Performance difference between two seemingly equivalent assembly codes
Asked Answered
F

2

2

tl;dr: I have two functionally equivalent C codes that I compile with Clang (the fact that it's C code doesn't matter much; only the assembly is interesting I think), and IACA tells me that one should be faster, but I don't understand why, and my benchmarks show the same performance for the two codes.

I have the following C code (ignore #include "iacaMarks.h", IACA_START, IACA_END for now):

ref.c:

#include "iacaMarks.h"
#include <x86intrin.h>

#define AND(a,b)  _mm_and_si128(a,b)
#define OR(a,b)   _mm_or_si128(a,b)
#define XOR(a,b)  _mm_xor_si128(a,b)
#define NOT(a)    _mm_andnot_si128(a,_mm_set1_epi32(-1))

void sbox_ref (__m128i r0,__m128i r1,__m128i r2,__m128i r3,
               __m128i* r5,__m128i* r6,__m128i* r7,__m128i* r8) {
  __m128i r4;

  IACA_START
  r3 = XOR(r3,r0);
  r4 = r1;
  r1 = AND(r1,r3);
  r4 = XOR(r4,r2);
  r1 = XOR(r1,r0);
  r0 = OR(r0,r3);
  r0 = XOR(r0,r4);
  r4 = XOR(r4,r3);
  r3 = XOR(r3,r2);
  r2 = OR(r2,r1);
  r2 = XOR(r2,r4);
  r4 = NOT(r4);
  r4 = OR(r4,r1);
  r1 = XOR(r1,r3);
  r1 = XOR(r1,r4);
  r3 = OR(r3,r0);
  r1 = XOR(r1,r3);
  r4 = XOR(r4,r3);
  *r5 = r1;
  *r6 = r4;
  *r7 = r2;
  *r8 = r0;
  IACA_END

}

I was wondering if I could optimize it by manually rescheduling a few instructions (I am well aware that the C compiler should produce an efficient scheduling, but my experiments have shown that it's not always the case). At some point, I tried the following code (it's the same as above, except that no temporary variables are used to store the results of the XORs that are later assigned to *r5 and *r6):

resched.c:

#include "iacaMarks.h"
#include <x86intrin.h>

#define AND(a,b)  _mm_and_si128(a,b)
#define OR(a,b)   _mm_or_si128(a,b)
#define XOR(a,b)  _mm_xor_si128(a,b)
#define NOT(a)    _mm_andnot_si128(a,_mm_set1_epi32(-1))

void sbox_resched (__m128i r0,__m128i r1,__m128i r2,__m128i r3,
                   __m128i* r5,__m128i* r6,__m128i* r7,__m128i* r8) {
  __m128i r4;

  IACA_START
  r3 = XOR(r3,r0);
  r4 = r1;
  r1 = AND(r1,r3);
  r4 = XOR(r4,r2);
  r1 = XOR(r1,r0);
  r0 = OR(r0,r3);
  r0 = XOR(r0,r4);
  r4 = XOR(r4,r3);
  r3 = XOR(r3,r2);
  r2 = OR(r2,r1);
  r2 = XOR(r2,r4);
  r4 = NOT(r4);
  r4 = OR(r4,r1);
  r1 = XOR(r1,r3);
  r1 = XOR(r1,r4);
  r3 = OR(r3,r0);
  *r7 = r2;
  *r8 = r0;
  *r5 = XOR(r1,r3); // This two lines are different
  *r6 = XOR(r4,r3); // (no more temporary variables)
  IACA_END
}

I'm compiling these codes using Clang 5.0.0 targeting my i5-6500 (Skylake), with the flags -O3 -march=native (I'm omitting the assembly code produced, as they can be found in the IACA outputs bellow, but if you'd prefer to have them directly here, ask me and I'll add them). I benchmarked those two codes and didn't find any performance difference between them. Out of curiosity, I ran IACA on them, and I was surprised to see that it said that the first version should take 6 cycles to run, and the second version 7 cycles. Here are the output produce by IACA:

For the first version:

dada@dada-ubuntu ~/perf % clang -O3 -march=native -c ref.c && ./iaca -arch SKL ref.o        
Intel(R) Architecture Code Analyzer Version -  v3.0-28-g1ba2cbb build date: 2017-10-23;16:42:45
Analyzed File -  ref_iaca.o
Binary Format - 64Bit
Architecture  -  SKL
Analysis Type - Throughput

Throughput Analysis Report
--------------------------
Block Throughput: 6.00 Cycles       Throughput Bottleneck: FrontEnd
Loop Count:  23
Port Binding In Cycles Per Iteration:
--------------------------------------------------------------------------------------------------
|  Port  |   0   -  DV   |   1   |   2   -  D    |   3   -  D    |   4   |   5   |   6   |   7   |
--------------------------------------------------------------------------------------------------
| Cycles |  6.0     0.0  |  6.0  |  1.3     0.0  |  1.4     0.0  |  4.0  |  6.0  |  0.0  |  1.4  |
--------------------------------------------------------------------------------------------------

DV - Divider pipe (on port 0)
D - Data fetch pipe (on ports 2 and 3)
F - Macro Fusion with the previous instruction occurred
* - instruction micro-ops not bound to a port
^ - Micro Fusion occurred
# - ESP Tracking sync uop was issued
@ - SSE instruction followed an AVX256/AVX512 instruction, dozens of cycles penalty is expected
X - instruction not supported, was not accounted in Analysis

| Num Of   |                    Ports pressure in cycles                         |      |
|  Uops    |  0  - DV    |  1   |  2  -  D    |  3  -  D    |  4   |  5   |  6   |  7   |
-----------------------------------------------------------------------------------------
|   1      | 1.0         |      |             |             |      |      |      |      | vpxor xmm4, xmm3, xmm0
|   1      |             | 1.0  |             |             |      |      |      |      | vpand xmm5, xmm4, xmm1
|   1      |             |      |             |             |      | 1.0  |      |      | vpxor xmm1, xmm2, xmm1
|   1      | 1.0         |      |             |             |      |      |      |      | vpxor xmm5, xmm5, xmm0
|   1      |             | 1.0  |             |             |      |      |      |      | vpor xmm0, xmm3, xmm0
|   1      |             |      |             |             |      | 1.0  |      |      | vpxor xmm0, xmm0, xmm1
|   1      | 1.0         |      |             |             |      |      |      |      | vpxor xmm1, xmm4, xmm1
|   1      |             | 1.0  |             |             |      |      |      |      | vpxor xmm3, xmm4, xmm2
|   1      |             |      |             |             |      | 1.0  |      |      | vpor xmm2, xmm5, xmm2
|   1      | 1.0         |      |             |             |      |      |      |      | vpxor xmm2, xmm2, xmm1
|   1      |             | 1.0  |             |             |      |      |      |      | vpcmpeqd xmm4, xmm4, xmm4
|   1      |             |      |             |             |      | 1.0  |      |      | vpxor xmm1, xmm1, xmm4
|   1      | 1.0         |      |             |             |      |      |      |      | vpor xmm1, xmm5, xmm1
|   1      |             | 1.0  |             |             |      |      |      |      | vpxor xmm4, xmm5, xmm3
|   1      |             |      |             |             |      | 1.0  |      |      | vpor xmm3, xmm0, xmm3
|   1      | 1.0         |      |             |             |      |      |      |      | vpxor xmm4, xmm4, xmm3
|   1      |             | 1.0  |             |             |      |      |      |      | vpxor xmm4, xmm4, xmm1
|   1      |             |      |             |             |      | 1.0  |      |      | vpxor xmm1, xmm1, xmm3
|   2^     |             |      | 0.3         | 0.3         | 1.0  |      |      | 0.3  | vmovdqa xmmword ptr [rdi], xmm4
|   2^     |             |      | 0.3         | 0.3         | 1.0  |      |      | 0.3  | vmovdqa xmmword ptr [rsi], xmm1
|   2^     |             |      | 0.3         | 0.3         | 1.0  |      |      | 0.3  | vmovdqa xmmword ptr [rdx], xmm2
|   2^     |             |      | 0.3         | 0.3         | 1.0  |      |      | 0.3  | vmovdqa xmmword ptr [rcx], xmm0
Total Num Of Uops: 26

For the second version:

dada@dada-ubuntu ~/perf % clang -O3 -march=native -c resched.c && ./iaca -arch SKL resched.o
Intel(R) Architecture Code Analyzer Version -  v3.0-28-g1ba2cbb build date: 2017-10-23;16:42:45
Analyzed File -  resched_iaca.o
Binary Format - 64Bit
Architecture  -  SKL
Analysis Type - Throughput

Throughput Analysis Report
--------------------------
Block Throughput: 7.00 Cycles       Throughput Bottleneck: Backend
Loop Count:  22
Port Binding In Cycles Per Iteration:
--------------------------------------------------------------------------------------------------
|  Port  |   0   -  DV   |   1   |   2   -  D    |   3   -  D    |   4   |   5   |   6   |   7   |
--------------------------------------------------------------------------------------------------
| Cycles |  6.0     0.0  |  6.0  |  1.3     0.0  |  1.4     0.0  |  4.0  |  6.0  |  0.0  |  1.3  |
--------------------------------------------------------------------------------------------------

DV - Divider pipe (on port 0)
D - Data fetch pipe (on ports 2 and 3)
F - Macro Fusion with the previous instruction occurred
* - instruction micro-ops not bound to a port
^ - Micro Fusion occurred
# - ESP Tracking sync uop was issued
@ - SSE instruction followed an AVX256/AVX512 instruction, dozens of cycles penalty is expected
X - instruction not supported, was not accounted in Analysis

| Num Of   |                    Ports pressure in cycles                         |      |
|  Uops    |  0  - DV    |  1   |  2  -  D    |  3  -  D    |  4   |  5   |  6   |  7   |
-----------------------------------------------------------------------------------------
|   1      | 1.0         |      |             |             |      |      |      |      | vpxor xmm4, xmm3, xmm0
|   1      |             | 1.0  |             |             |      |      |      |      | vpand xmm5, xmm4, xmm1
|   1      |             |      |             |             |      | 1.0  |      |      | vpxor xmm1, xmm2, xmm1
|   1      | 1.0         |      |             |             |      |      |      |      | vpxor xmm5, xmm5, xmm0
|   1      |             | 1.0  |             |             |      |      |      |      | vpor xmm0, xmm3, xmm0
|   1      |             |      |             |             |      | 1.0  |      |      | vpxor xmm0, xmm0, xmm1
|   1      | 1.0         |      |             |             |      |      |      |      | vpxor xmm1, xmm4, xmm1
|   1      |             | 1.0  |             |             |      |      |      |      | vpxor xmm3, xmm4, xmm2
|   1      |             |      |             |             |      | 1.0  |      |      | vpor xmm2, xmm5, xmm2
|   1      | 1.0         |      |             |             |      |      |      |      | vpxor xmm2, xmm2, xmm1
|   1      |             | 1.0  |             |             |      |      |      |      | vpcmpeqd xmm4, xmm4, xmm4
|   1      |             |      |             |             |      | 1.0  |      |      | vpxor xmm1, xmm1, xmm4
|   1      | 1.0         |      |             |             |      |      |      |      | vpor xmm1, xmm5, xmm1
|   1      |             | 1.0  |             |             |      |      |      |      | vpxor xmm4, xmm5, xmm3
|   1      |             |      |             |             |      | 1.0  |      |      | vpor xmm3, xmm0, xmm3
|   2^     |             |      | 0.3         | 0.4         | 1.0  |      |      | 0.3  | vmovdqa xmmword ptr [rdx], xmm2
|   2^     |             |      | 0.3         | 0.3         | 1.0  |      |      | 0.4  | vmovdqa xmmword ptr [rcx], xmm0
|   1      | 1.0         |      |             |             |      |      |      |      | vpxor xmm0, xmm4, xmm3
|   1      |             | 1.0  |             |             |      |      |      |      | vpxor xmm0, xmm0, xmm1
|   2^     |             |      | 0.4         | 0.3         | 1.0  |      |      | 0.3  | vmovdqa xmmword ptr [rdi], xmm0
|   1      |             |      |             |             |      | 1.0  |      |      | vpxor xmm0, xmm1, xmm3
|   2^     |             |      | 0.3         | 0.4         | 1.0  |      |      | 0.3  | vmovdqa xmmword ptr [rsi], xmm0
Total Num Of Uops: 26
Analysis Notes:
Backend allocation was stalled due to unavailable allocation resources.

As you can see, on the second version, IACA says that the bottleneck is the backend and that "Backend allocation was stalled due to unavailable allocation resources".

Both assembly codes contain the same instructions, and the only differences are the scheduling of the last 7 instructions, as well as the registers they use.

The only thing I can think of that would explain why the second code is slower is the fact that it writes twice xmm0 in the last 4 instructions, thus introducing a dependency. But since those writes are independent, I would expect the CPU to use different physical registers for them. However, I can't really prove that theory. Also, if using twice xmm0 like that were an issue, I would expect Clang to use a different register for one of the instructions (in particular since the register pressure here is low).

My question: is the second code supposed to be slower (based on the assembly code), and why?

Edit: IACA traces:

First version: https://pastebin.com/qGXHVW6a
Second version: https://pastebin.com/dbBNWsc2


Note: the C codes are implementations of Serpent cipher's first S-box, computed by Osvik here.

Fillin answered 7/8, 2018 at 9:52 Comment(12)
I don't really like the title, and I'm not sure of the tags I should have used, so please, feel free to edit any of those.Fillin
IACA is probably wrong, it's not rare. It's handy for counting uops and identifying port pressure, but it's not super reliable. However, you must have benchmarked this in a loop. Did you try putting IACA_START at the top of the loop body and IACA_END after the closing brace? That way IACA sees the whole actual loop including the conditional branch and loop overhead.Pentstemon
And BTW, no, modern OoO execution CPUs do not have output dependencies. They use register-renaming to avoid WAW (write-after-write hazards). See Why does mulss take only 3 cycles on Haswell, different from Agner's instruction tables? for a more detailed explanation of register renaming and what it means for dependent vs. independent writes of the same register. (Note that vpxor xmm0, xmm0, xmm1 also reads XMM0, as well as writing it, so that instruction does have a dep on XMM0).Pentstemon
@PeterCordes IACA reports the same performances for the loop as when I'm measuring outside any loop (probably because it says the add/jnz (for the increment/jump) are not bound to any port,.. which is a bit surprising, right?).Fillin
@PeterCordes Thanks for that link, very interesting. Also, it confirms that xmm0 isn't the issue. (I was talking about the instruction vpxor xmm0, xmm1, xmm3 which has a WAR dependency with the previous instruction, but "not really"; but according to your link, only the RAW dependencies remain, so that one isn't an issue).Fillin
Are you sure you're not being fooled by macro-fusion of the add with the jnz? One of the instructions will show no uops, because the macro-fuse (in the decoders) into a single add-and-branch uop that will run on port 6 only (because predicted-taken uops only run on port6). Predicted-not-taken uops can run on p06.Pentstemon
@PeterCordes IACA says that jnz macro-fuses with add, but says that both add and jnz are not bound to a port. It also says that no instruction is executed on port 6.Fillin
Then it's wrong :/ Jump instructions do execute on a port, not handled in the issue/rename stage like xor-zeroing or mov-elimination.Pentstemon
Can you show the IACA trace emitted using -trace for both codes? I would have generated them myself, but I cannot install Clang 5.0 because I don't want to remove an older version (Clang 3.8). When I use 3.8, the generated codes are different and both codes are backend-bound, which makes sense to me.Internment
@HadiBrais Here you go.Fillin
You realize you're showing traces for the non-inlined version of your function, right? That's why there are 4 stores to memory, and the outputs aren't fed back into the function inputs in any organized or correct way; just by chance happening to use xmm0..3. Use the actual loop; it's silly to use IACA on this version because it's not a loop body. One might have a shorter-than-realistic dep chain than the other just by random chance of register-allocation choices.Pentstemon
@PeterCordes Oh, sorry, when you mentioned putting the code in a loop, I didn't understand that one of the goal was removing the loads/stores. By manually writing the loop and keeping the code as is, with just an additional add/jnz, nothing changes according to IACA. But if I let Clang take care of the loop, it will remove the loads/stores, hoist the vpcmpeqd (and to do some unrolling, but -fno-unroll-loops takes care of that), and in fact, both codes are identical.Fillin
I
6

Figuring out why the second code is backend-bound requires some amount of manual analysis because the output emitted by IACA is too raw, although extremely rich in information. Note that the traces emitted by IACA are particularly useful for analyzing loops They can be also useful for understanding how straight-line sequences of instructions get executed (which is not as useful), but the emitted traces need to be interpreted differently. Throughput the rest of this answer, I will present my analysis for loop scenario, which is more difficult to do.

The fact that you emitted the traces without putting the code in a loop affects the following things:

  • the compiler couldn't inline and optimize away the stores to the output operands. They wouldn't appear at all in a real loop, or if chaining this to a different S-box.
  • the data dependencies from outputs to inputs happens by coincidence as the compiler used xmm0..3 to prepare data to be stored, not as consequence of choosing which output to feed back into which input of the same S-box.
  • the vpcmpeqd that creates an all-ones vector (for NOT) would be hoisted out of the loop after inlining.
  • There would be a dec/jnz or equivalent loop overhead (which can macro-fused into a single uop for port 6).

But you've asked IACA to analyze this exact block of asm as if it were run in a loop. So to explain the results, that's how we'll think of it (even though it's not what you'd get from a C compiler if you used this function in a loop).

A jmp or dec/jnz at the bottom to make this a loop is not a problem in this case: It will always get executed on port 6, which is not used by any vector instruction. This means that the jump instruction will not contend on port 6 and will not consume scheduler uop bandwidth that would otherwise have been used by other instructions. However, this can impact the resource allocator bandwidth in the issue/rename stage (which is no more than 4 fused domain uops per cycle), but this is not important in this particular case as I will discuss.

Let's first examine the port pressure ASCII figure:

| Num Of   |                    Ports pressure in cycles                         |      |
|  Uops    |  0  - DV    |  1   |  2  -  D    |  3  -  D    |  4   |  5   |  6   |  7   |
-----------------------------------------------------------------------------------------
|   1      | 1.0         |      |             |             |      |      |      |      | vpxor xmm4, xmm3, xmm0
|   1      |             | 1.0  |             |             |      |      |      |      | vpand xmm5, xmm4, xmm1
|   1      |             |      |             |             |      | 1.0  |      |      | vpxor xmm1, xmm2, xmm1
|   1      | 1.0         |      |             |             |      |      |      |      | vpxor xmm5, xmm5, xmm0
|   1      |             | 1.0  |             |             |      |      |      |      | vpor xmm0, xmm3, xmm0
|   1      |             |      |             |             |      | 1.0  |      |      | vpxor xmm0, xmm0, xmm1
|   1      | 1.0         |      |             |             |      |      |      |      | vpxor xmm1, xmm4, xmm1
|   1      |             | 1.0  |             |             |      |      |      |      | vpxor xmm3, xmm4, xmm2
|   1      |             |      |             |             |      | 1.0  |      |      | vpor xmm2, xmm5, xmm2
|   1      | 1.0         |      |             |             |      |      |      |      | vpxor xmm2, xmm2, xmm1
|   1      |             | 1.0  |             |             |      |      |      |      | vpcmpeqd xmm4, xmm4, xmm4
|   1      |             |      |             |             |      | 1.0  |      |      | vpxor xmm1, xmm1, xmm4
|   1      | 1.0         |      |             |             |      |      |      |      | vpor xmm1, xmm5, xmm1
|   1      |             | 1.0  |             |             |      |      |      |      | vpxor xmm4, xmm5, xmm3
|   1      |             |      |             |             |      | 1.0  |      |      | vpor xmm3, xmm0, xmm3
|   2^     |             |      | 0.3         | 0.4         | 1.0  |      |      | 0.3  | vmovdqa xmmword ptr [rdx], xmm2
|   2^     |             |      | 0.3         | 0.3         | 1.0  |      |      | 0.4  | vmovdqa xmmword ptr [rcx], xmm0
|   1      | 1.0         |      |             |             |      |      |      |      | vpxor xmm0, xmm4, xmm3
|   1      |             | 1.0  |             |             |      |      |      |      | vpxor xmm0, xmm0, xmm1
|   2^     |             |      | 0.4         | 0.3         | 1.0  |      |      | 0.3  | vmovdqa xmmword ptr [rdi], xmm0
|   1      |             |      |             |             |      | 1.0  |      |      | vpxor xmm0, xmm1, xmm3
|   2^     |             |      | 0.3         | 0.4         | 1.0  |      |      | 0.3  | vmovdqa xmmword ptr [rsi], xmm0

The total number of fused domain uops is 22. 6 different uops have been assigned to each of port 0, 1, and 5. The other 4 uops each consists of an STD and STA uops. STD requires port 4. This assignment is reasonable. If we ignore all data dependencies, it appears the scheduler should be able to dispatch at least 3 fused domain uops every cycle. However, there can be serious contention at port 4, which may lead to filling up the reservation station. According to IACA, that is not the bottleneck in this code. Note that if the scheduler could somehow achieve a throughput that is equal to the maximum throughput of the allocator, then the code could only be frontend-bound. Obviously, this is not the case here.

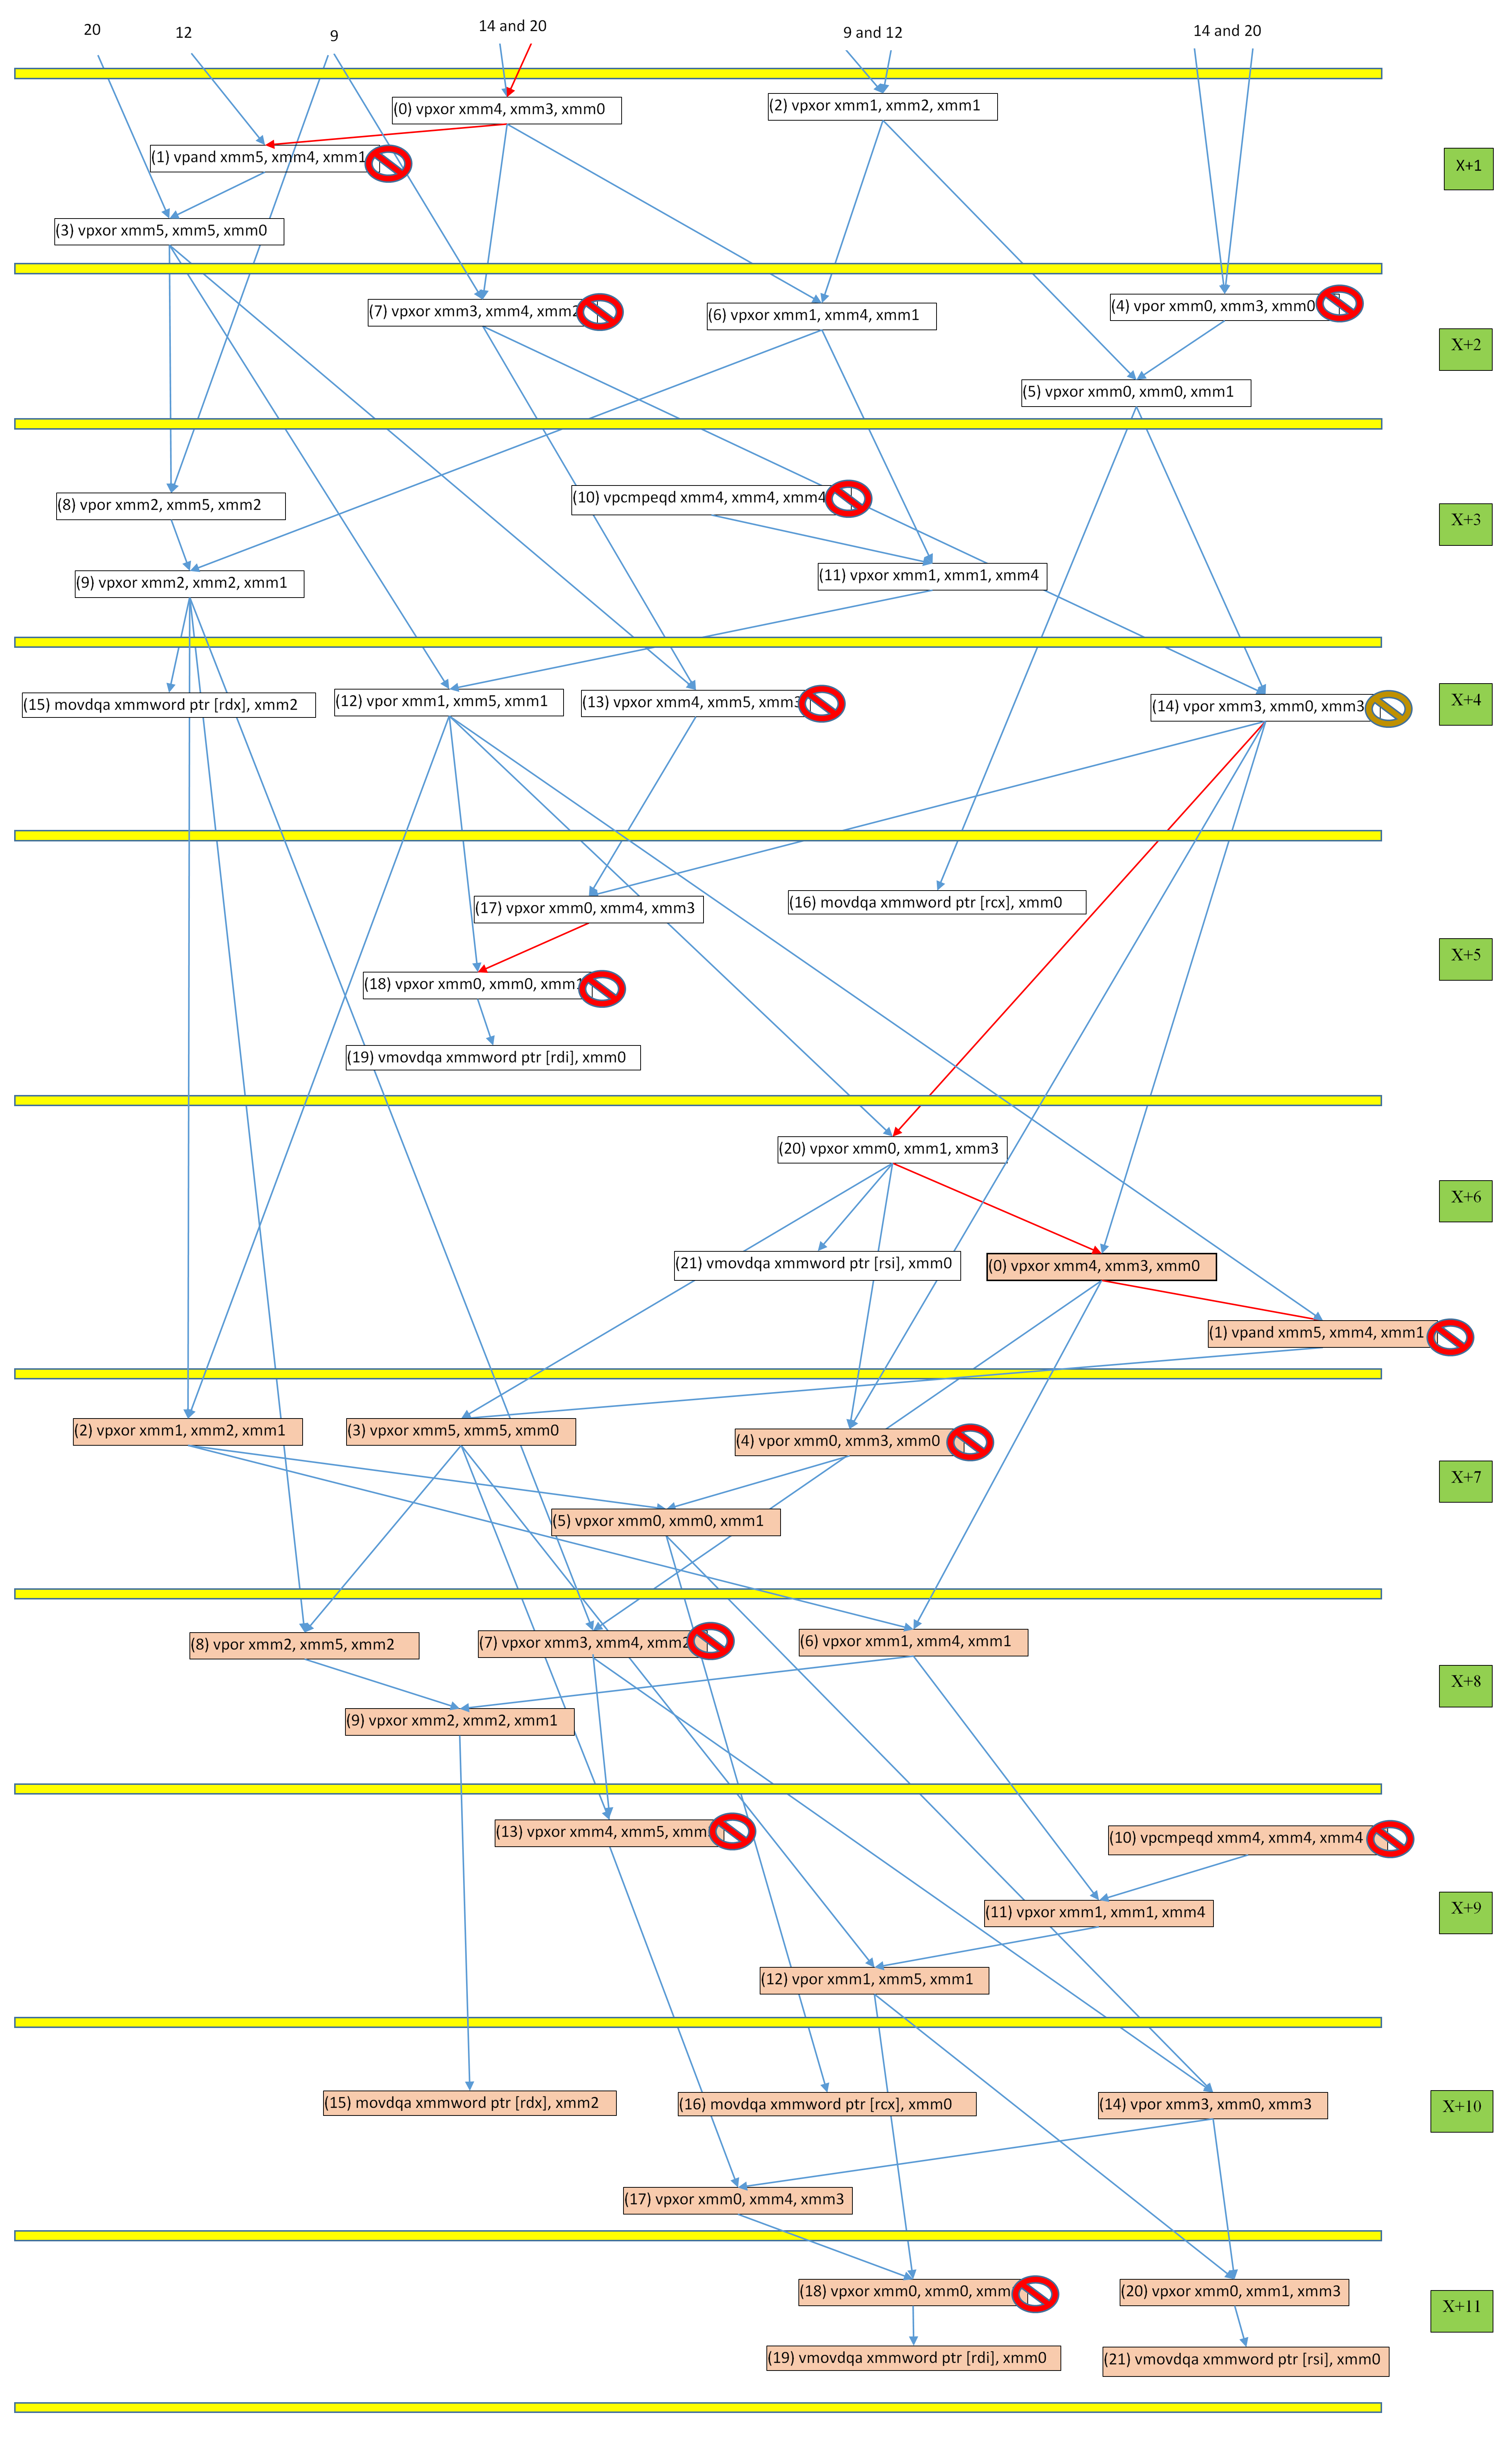
The next step is to carefully examine the IACA trace. I made the following data flow graph based on the trace, which is easier to analyze. The horizontal yellow lines divide the graph according to which uops get allocated in the same cycle. Note that IACA always assumes perfect branch prediction. Also note that this division is about 99% accurate, but not 100%. This is not important and you can just consider it 100% accurate. The nodes represent fused uops and the arrows represent data dependence (where the arrow points to the destination uop). Nodes are colored depending on which loop iteration they belong to. The sources of the arrows at the top of the graph are omitted for clarity. The green boxes on the right contain the cycle number at which allocation is performed for the corresponding uops. So the previous cycle is X, and the current cycle is X + 1, whatever X is. The stop signs indicate that the associated uop suffers contention at one of the ports. All the red stop signs represent contention on port 1. There is only one other stop sign of different color that represents contention on port 5. There are are cases of contention, but I'll omitted them for clarity. Arrows come in two colors: blue and red. The ones are the critical ones. Note that it takes 11 cycles to allocate 2 iterations worth of instructions, and then the allocation pattern repeats. Keep in mind that Skylake has 97 RS entires.

The location of a node within each division (the "local" location) has a meaning. If two nodes are on the same row and if all of their operands are available, then it means that they can be dispatched in the same cycle. Otherwise, if the nodes are not on the same row, then they may not be dispatched in the same cycle. This only applies to dynamic uops that have been allocated together as a group and not to dynamic uops allocated as part of different groups even if they happen to be in the same division in the graph.

enter image description here

I'll use the notation (it, in) to identify a specific fused uop, where it is a zero-based loop iteration number and in is a zero-based uop number. The most important part of the IACA trace is the one that shows the pipeline stages for (11, 5):

11| 5|vpxor xmm0, xmm0, xmm1                            :          |         |         |         |         |         |         |         |         |         |         |         |         |         |         
11| 5|    TYPE_OP (1 uops)                              :          |         |         |         |         |         |_A--------------------dw----R-------p  |         |         |         |         |         

This tells us that the allocation bandwidth is underutilized at this point due to unavailable resources (in this case, an entry in the reservation station). This means that the scheduler was not able to sustain a high enough throughput of unfused uops to keep up with the front-end 4 fused uops per cycle. Since IACA has already told us that the code is backend-bound, then obviously the reason for this underutilization is not because of some long dependency chain or contention at specific execution units, but rather something more complicated. So we need to do more work to figure out what's going on. We have to analyze past (11, 5).

The uops 1, 4, 7, 10, 13, 18 of every iteration are all assigned to port 1. What happens during a period of 11 cycles? There are a total of 12 uops that require port 1, so it's impossible to dispatch all of them in 11 cycles because it will take at least 12 cycles. Unfortunately, data dependencies within the uops that require the same port and across uops that require other ports exacerbate the problem significantly. Consider the following pipeline flow during an 11-cycle period:

  • At cycle 0: (0, 0) and (0, 1) get allocated (along with other uops that we don't care about right now). (0, 1) is data-dependent on (0, 0).
  • 1: (0, 4) and (0, 7) get allocated. Assuming that no older and ready uops is assigned to port 0 and that the operands of (0, 0) are ready, dispatch (0, 0) to port 0. Port 1 potentially remains idle because (0, 1) is not ready yet.
  • 2: The result of (0, 0) is available through the the bypass network. At this point, (0, 1) can and will be dispatched. However, even if (0, 4) or (0, 7) are ready, neither is the oldest uop assigned to port 1, so it both get blocked. (0, 10) gets allocated.
  • 3: (0, 4) is dispatched to port 1. (0, 7) and (0, 10) both get blocked even if their operands are ready. (0, 13) gets allocated.
  • 4: (0, 7) is dispatched to port 1. (0, 10) gets blocked. (0, 13) has to wait for (0, 7). (0, 18) gets allocated.
  • 5: (0, 10) is dispatched to port 1. (0, 13) gets blocked. (0, 18) has to wait for (0, 17) which depends on (0, 13). (1, 0) and (1, 1) get allocated.
  • 6: (0, 13) is dispatched to port 1. (0, 18) has to wait for (0, 17) which depends on (0, 13). (1, 1) has to wait for (1, 0). (1, 0) cannot be dispatched because the distance between (1, 0) and (0, 7) is 3 uops, one of which may suffer a port conflict. (1, 4) gets allocated.
  • 7: Nothing gets dispatched to port 1 because (0, 18), (1, 1), and (1, 4) are not ready. (1, 7) gets allocated.
  • 8: Nothing gets dispatched to port 1 because (0, 18), (1, 1), (1, 4), and (1, 7) are not ready. (1, 10) and (1, 13) get allocated.
  • 9: (0, 18) is dispatched to port 1. (1, 10) and (1, 4) are ready but get blocked due to port contention. (1, 1), (1, 7), and (1, 13) are not ready.
  • 10: (1, 1) is dispatched to port 1. (1, 4), (1, 7), and (1, 10) are ready but get blocked due to port contention. (1, 13) is not ready. (1, 18) gets allocated.

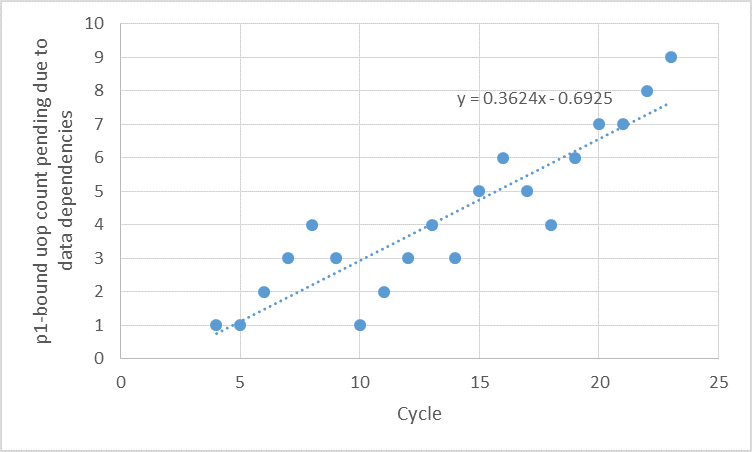
Well, ideally, we'd like 11 of the 12 uops to be dispatched to port 1 in 11 cycles. But this analysis shows that the situation is far from ideal. Port 1 is idle for 4 out of the 11 cycles! If we assume that some (X, 18) from a previous iteration gets dispatched at cycle 0, then port 1 would be idle for 3 cycles, which is a lot of waste, considering that we have 12 uops that require it every 11 cycles. Out of the 12 uops, only up to 8 got dispatched. How bad can the situation get? We can continue analyzing the trace and record how the number of p1-bound uops that are either ready to be dispatched but blocked due to conflict, or are not ready due to data decencies. I was able to determine that that the number of p1-bound uops stalled due to port conflict is never larger than 3. However, the number of p1-bound uops stalled due due to data decencies is overall increasing gradually with time. I did not see any pattern the way it increases, so I decided to use linear regression on the first 24 cycles of the trace to predict at what point there would be 97 such uops. The following figure shows that.

enter image description here

The x-axis represents the zero-based cycles increasing from left to right. Note that the number of uops is zero for the first 4 cycles. The y-axis represents the number of such uops at the corresponding cycle. The linear regression equation is:

y = 0.3624x - 0.6925.

By setting y to 97 we get:

x = (97 + 0.6925) / 0.3624 = 269.57

That is, at about cycle 269, we expect that there are 97 uops in the RS all p1-bound and waiting for their operands to become ready. It is at this point the RS is full. However, there can be other uops that are waiting in the RS for other reasons. So we expect that the allocator underutilize its bandwidth at or before cycle 269. by looking at the IACA trace for instruction (11, 5), we can see that the situation happens at cycle 61, which is much earlier than 269. This means that either my predictor is very optimistic or that the counts of uops bound to other ports exhibit also a similar behavior. My guts tell me it's the latter. But that is good enough to understand why IACA has said that the code is backend-bound. You can perform a similar analysis on the first code to understand why it's frontend-bound. I guess I'll just leave as an exercise for the reader.

This manual analysis can be followed in case IACA does not support a particular piece of code or when a tool like IACA does not exist for a particular microarhcitecture. The linear regression model enables to estimate after how many iterations the allocator underutilizes its bandwidth. For example in this case, cycle 269 corresponds to iteration 269/11/2 = 269/22 = 12. So as long as the maximum number of iterations is not much larger than 12, the backend performance of the loop would be less of an issue.

There is a related post by @Bee: How are x86 uops scheduled, exactly?.

I may post the details of what happens during the first 24 cycles later.

Side note: There are two errors in Wikichip's article on Skylake. First, Broadwell's scheduler has 60 entires, not 64. Second, the allocator's throughput is up to 4 fused uops only.

Internment answered 9/8, 2018 at 8:39 Comment(13)
Failure to put the code in a loop doesn't just mean adding a port 6 dec/jnz at the bottom of this block. It means the stores go away, and the outputs will end up in the right registers to be inputs next iteration. (I haven't gotten through your whole answer yet, maybe you're right that it doesn't end up mattering, but it's still a big deal to get that right before spending a lot of time analyzing things.)Pentstemon
In a loop, the pcmpeqd would (hopefully) be hoisted, even if chaining this with other S-boxes (because they probably also use some NOT). If RS size is a bottleneck (rather than any specific port), then yeah getting rid of the micro-fused stores could matter. I think they're just output operands that will optimize away when inlining. Interesting answer, I've wondered but never gone in this much depth to figure out if RS size vs. ROB size is more important for finding ILP across loop iterations, with/without software pipelining.Pentstemon
If the RS was really filling up with uops for one port more than the others, the issue/rename stage would adjust the scheduling. I think How are x86 uops scheduled, exactly?/ is the link you're looking for. Resource conflicts delaying the critical path would reduce as more un-executed uops built up for the port that was behind (and thus currently the critical path). IDK how accurately IACA models that.Pentstemon
I don't understand what you're saying about uops that issued in a group together vs. uops that could dispatch in the same cycle (in the paragraph before the dependency chart). I get that rows within divisions represent data dependencies, but I don't know why issuing in the same 4-uop group matters. If they were allocated to different ports, they can dispatch in the same cycle regardless of which cycle they were allocated in.Pentstemon
Thanks, that's a very interesting and thorough answer. I'm going to have to read it again a few times to fully understand everything that's going on, but thanks for that very detailed analysis!Fillin
@PeterCordes Regarding your first comment, you're right in general. But I wanted to do this analysis anyway just for fun. Regarding your second comment, I'm not sure if hoisting pcmpeqd would be useful in this case because it only suffers p1 conflicts and those are never larger than 3 uops at any given cycle in contrast to p1 uop count that are not ready. Re third comment, yes, but in this case, it seems to me that the data dependencies are more critical here than the potential sub-optimal scheduling...Internment
...As the trace shows, p1 gets idle occasionally which is catastrophic for perf in this case. I also don't know how accurate IACA is, but it must be accurate enough for the tool to be useful. Thanks for finding Bee's post, that is indeed what I was looking for.Internment
I slapped a dec/jnz at the bottom of these and actually benchmarked them on my SKL. sbox_ref runs ~7.5c per iter, sbox_resched runs ~8.04 c/iter. So IACA is numerically wrong, and neither is bottlenecked on the front-end. Neither one saturates any of p015. But IACA is right that sbox_resched is slower. IACA2.3 gives about the same results, but avoids the error of saying that the dec/jnz isn't bound to a port. (And it says sbox_ref runs 6.19c instead of 6.)Pentstemon
Commenting out the stores in sbox_resched makes it run slower. Weird. Writing up my results in an answer.Pentstemon
@PeterCordes Thanks for doing this. Note that IACA did not say that any particular port will saturate because some ports are becoming idle, so the results you got that p015 do not get saturated seem consistent with that, unless I misunderstood you. The dec/jnz may impact the output of IACA. Can you generate the trace with dec/jnz and share it with me? With dec/jnz, it makes sense to me that the throughput increased by about 14%. The combination of uops that the scheduler receives is different which can impact the order in which uops conflict and become ready.Internment
I'm about to head out for a couple hours for an Ultimate [frisbee] game, but I'll generate a trace after I get back. IACA3.0 thinks dec/jnz is not bound to a port, so IDK what we'll see. It can execute right away, so it's only ROB size (not RS size) that will matter for it. It will change front-end issue grouping, but the front-end isn't the bottleneck. I guess that could change port allocation, but it's not clear why that would make things much worse. (The OP's results for sched_ref show that IACA thinks p015 will be saturated, that's why I pointed out that doesn't happen.)Pentstemon
@PeterCordes Don't forget to pass -trace to IACA to get the trace. The ASCII figure from IACA only shows port pressure, not saturation. If a particular port is saturated, IACA will tell you that instead of Throughput Bottleneck: Backend.Internment
@PeterCordes you haven't posted your answer yet (not blaming you of course). Still I'm quite interested in what you found. Just in case you won't have enough time to go to the bottom of it, it would be awesome if you could give us your partial results :) (but if you haven't forgotten about it and you are just taking your time to answer, then nevermind me and do your thing!)Fillin
P
3

I benchmarked those two codes and didn't find any performance difference between them.

I did the same thing on my Skylake i7-6700k, actually benchmarking what you told IACA to analyze, by taking that asm and slapping a dec ebp / jnz .loop around it.

I found sbox_ref runs at ~7.50 cycles per iteration, while sbox_resched runs at ~8.04 c/iter, tested in a static executable on Linux, with performance counters. (See Can x86's MOV really be "free"? Why can't I reproduce this at all? for details of my test methodology). IACA's numbers are wrong, but it is correct that sbox_resched is slower.

Hadi's analysis appears correct: the dependency chains in the asm are long enough that any resource conflicts in uop scheduling will cause the back-end to lose throughput that it can never catch up from.


Presumably you benched by letting a C compiler inline that function into a loop, with local variables for the output operands. That will change the asm significantly (these are the reverse of the bullet points I edited into @Hadi's answer before writing my own):

  • Instead of happening by accident as the compiler uses xmm0..3 as scratch registers late in the function, the data dependencies from outputs to inputs are visible to the compiler so it can schedule appropriately. Your source code will choose which output to feed back into which input of the same S-box.

    Or the deps don't exist (if you use constant inputs and avoid having the loop optimize away using volatile or an empty inline asm statement).

  • The stores to the output operands optimize away, like would happen for real if chaining this to a different S-box.

  • the vpcmpeqd that creates an all-ones vector (for NOT) would be hoisted out of the loop after inlining.

As Hadi says, the 1 uop macro-fused dec/jnz loop overhead doesn't compete for vector ALUs, so it itself isn't important. What is critically important is that slapping an asm loop around something the compiler didn't optimize as a loop body unsurprisingly gives silly results.

Pentstemon answered 20/1, 2019 at 18:54 Comment(1)
I had this partially-written answer in an old browser tab. I don't know why I didn't post it before; I forget what else I had been planning to say so I guess I'll post it now. Let me know if there's something that doesn't make sense.Pentstemon

© 2022 - 2024 — McMap. All rights reserved.