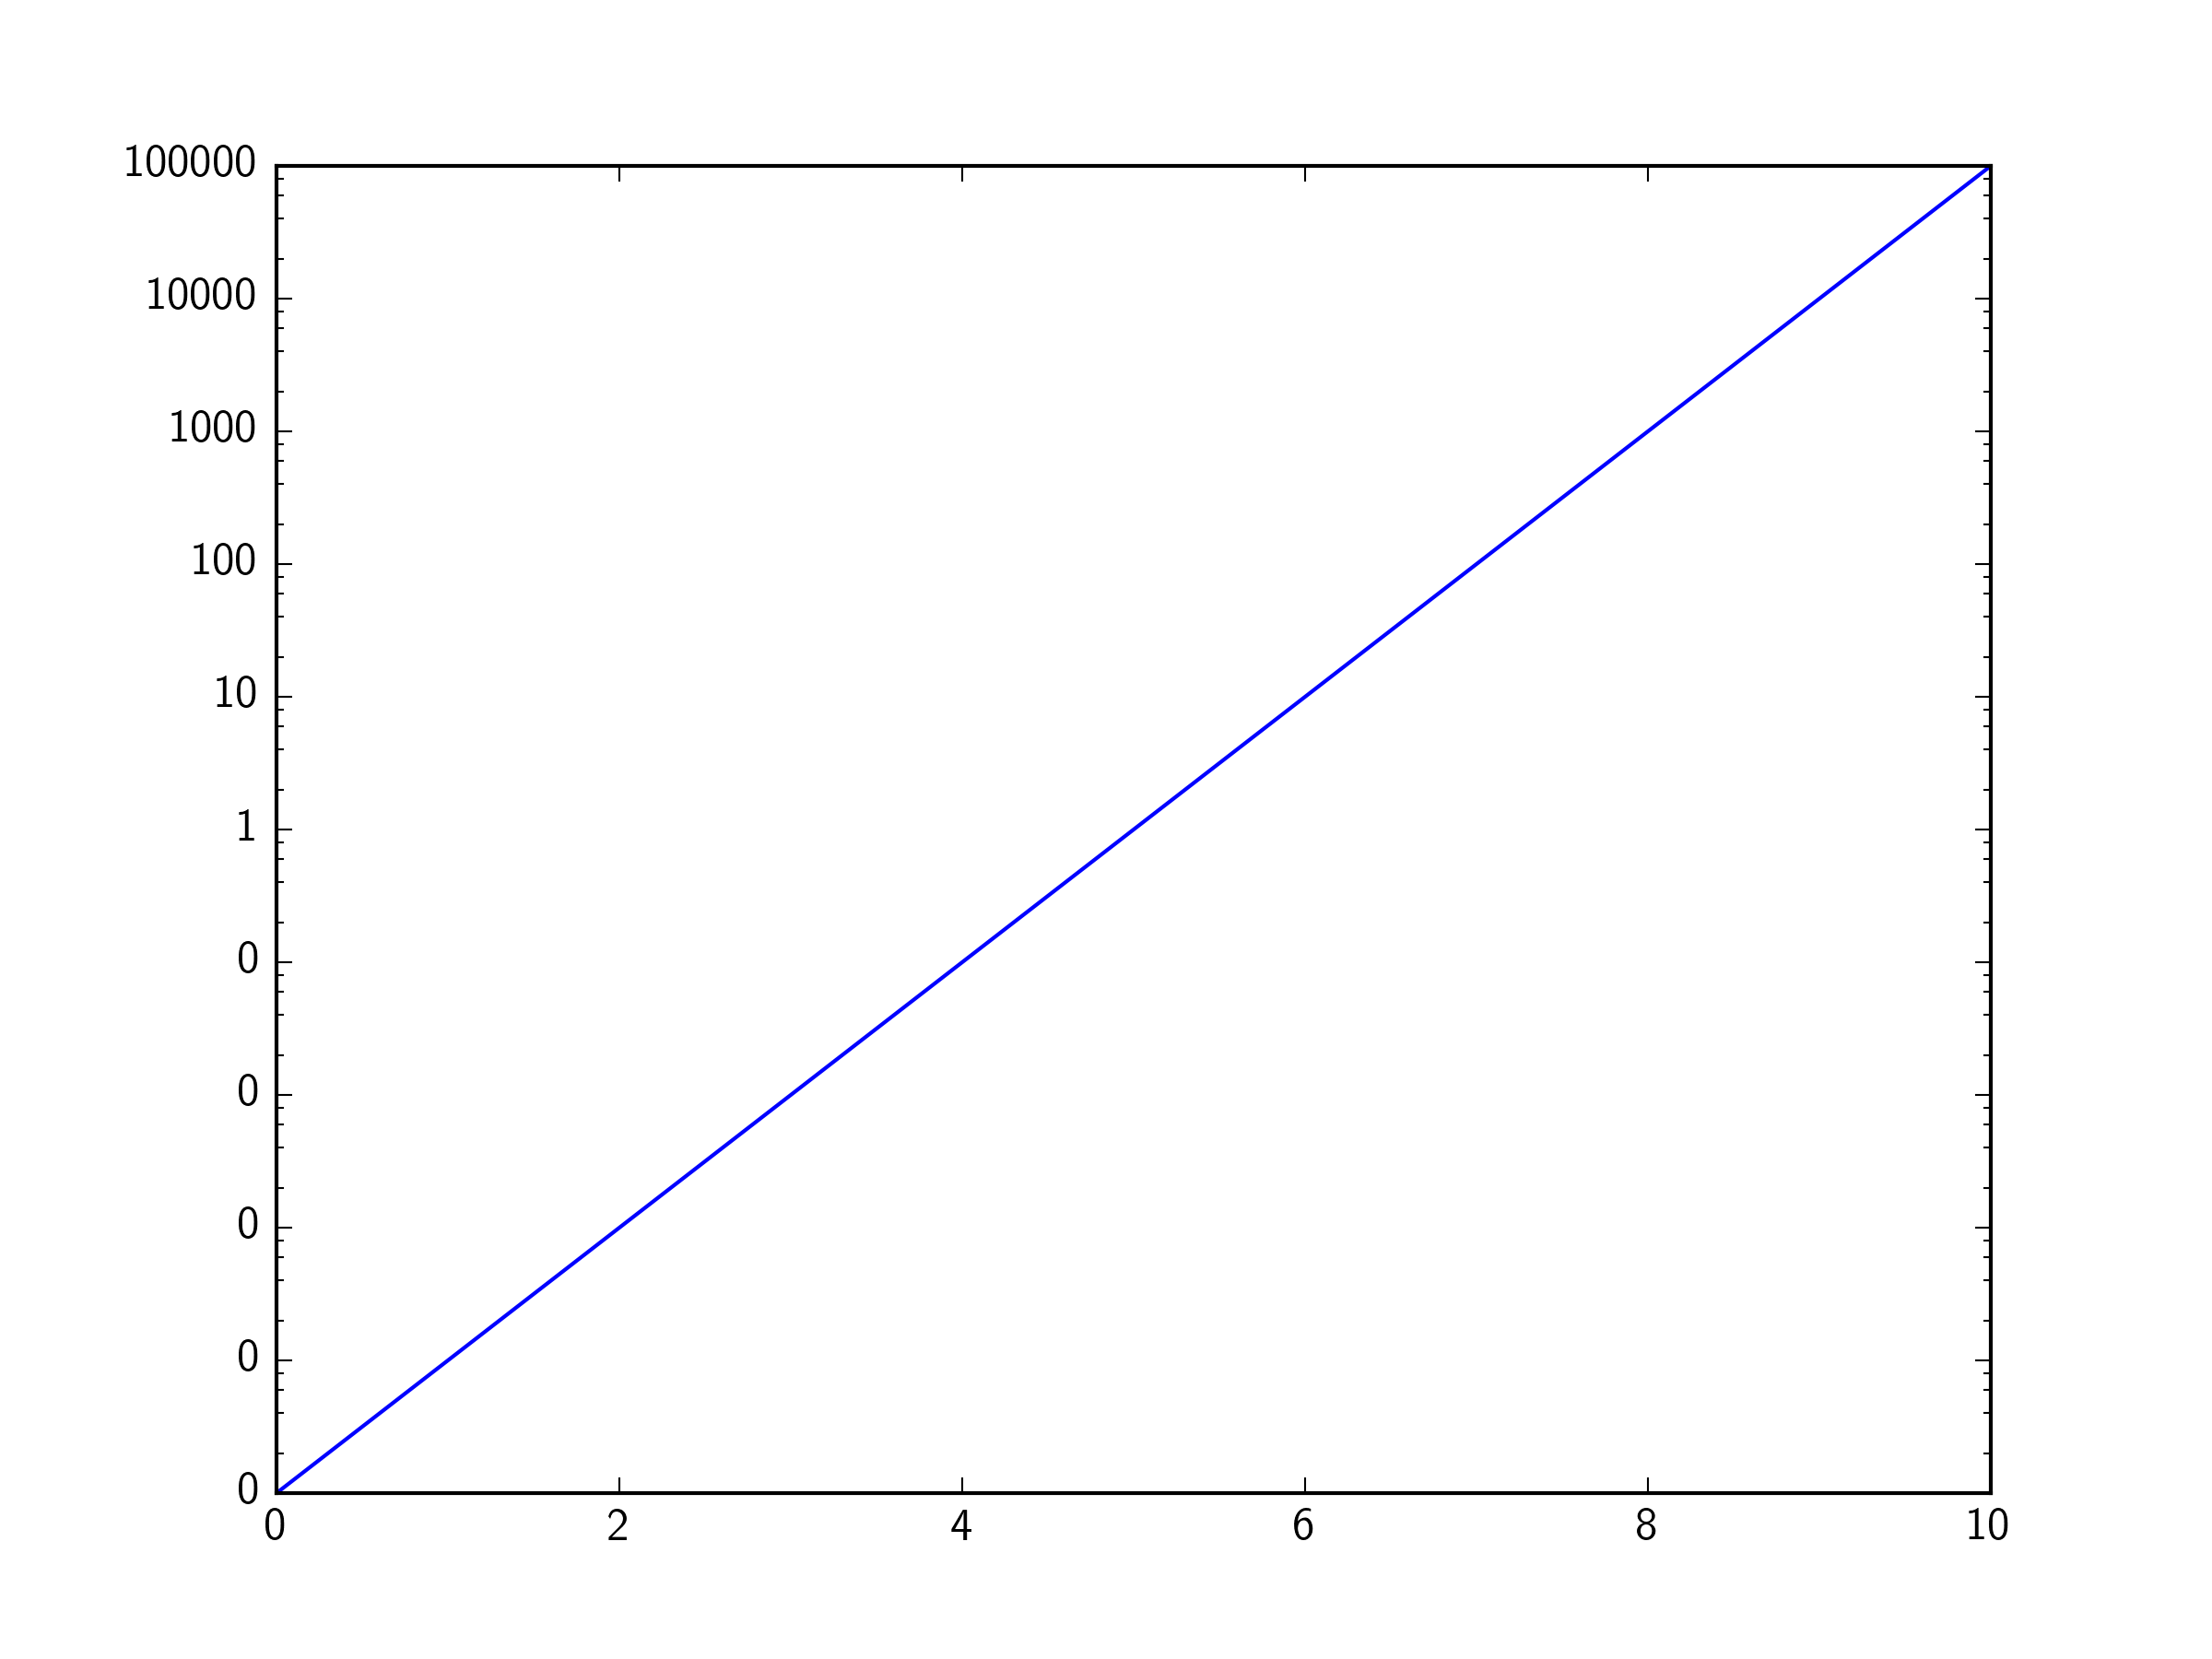
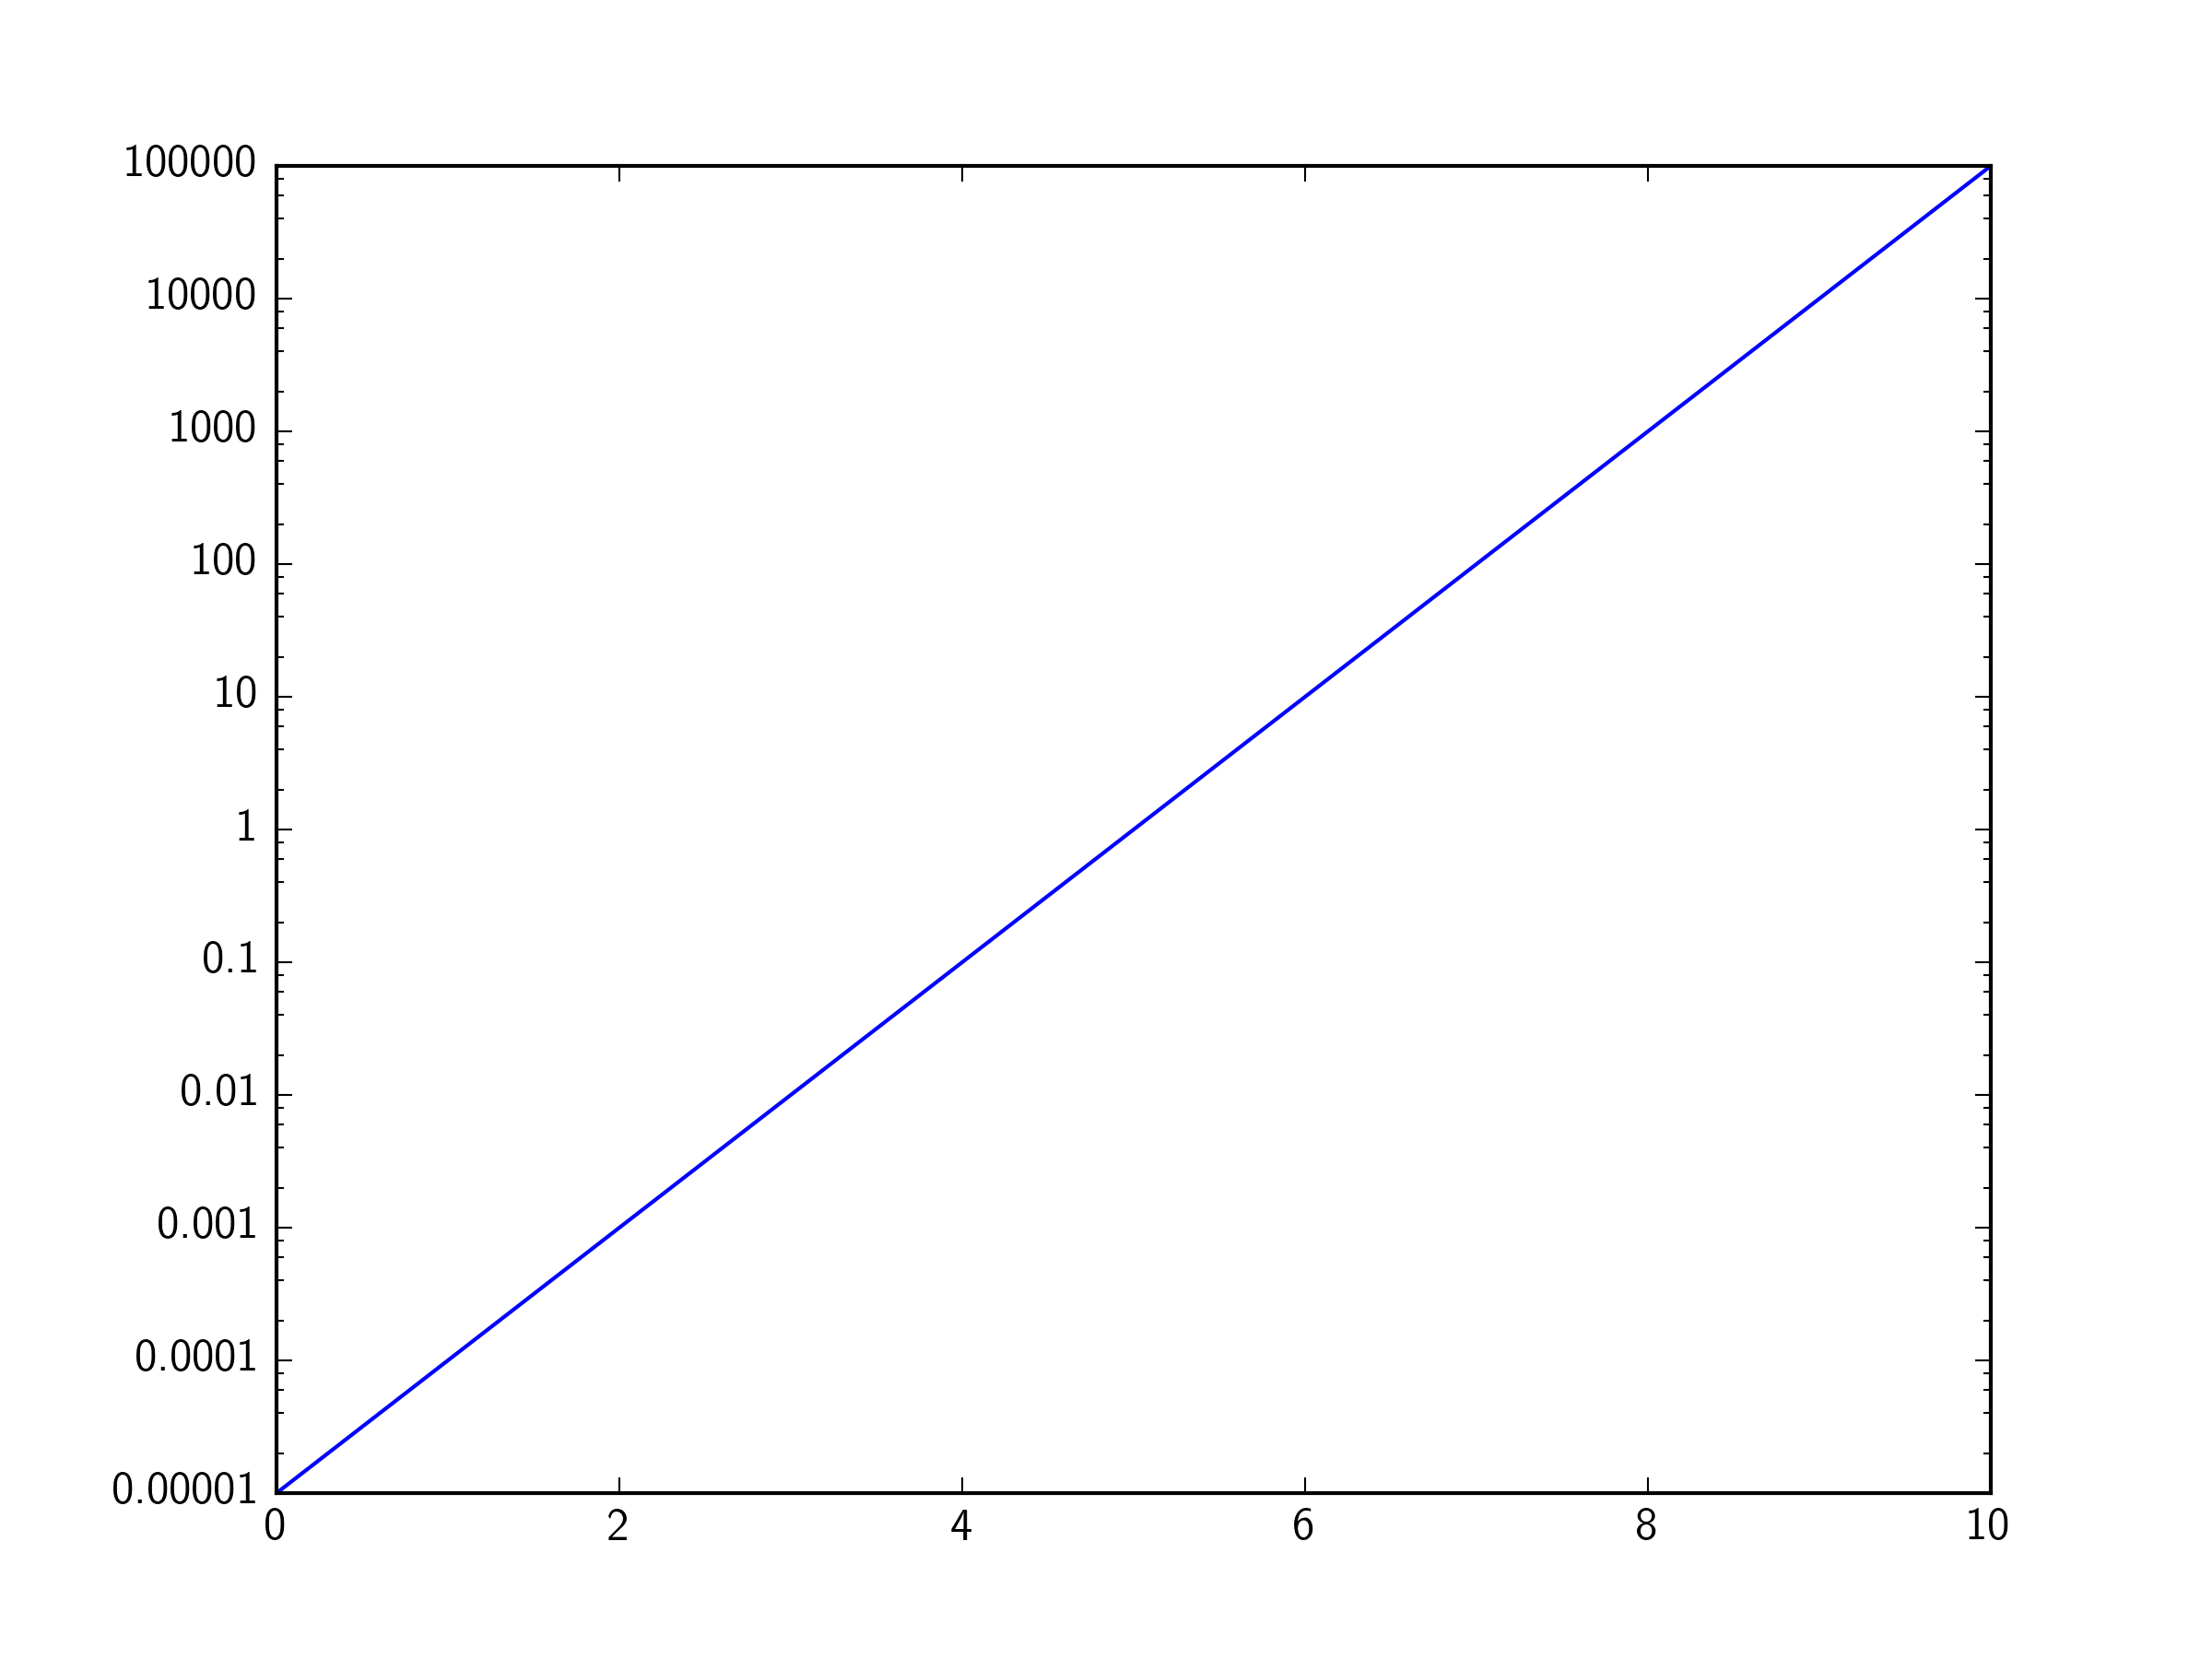
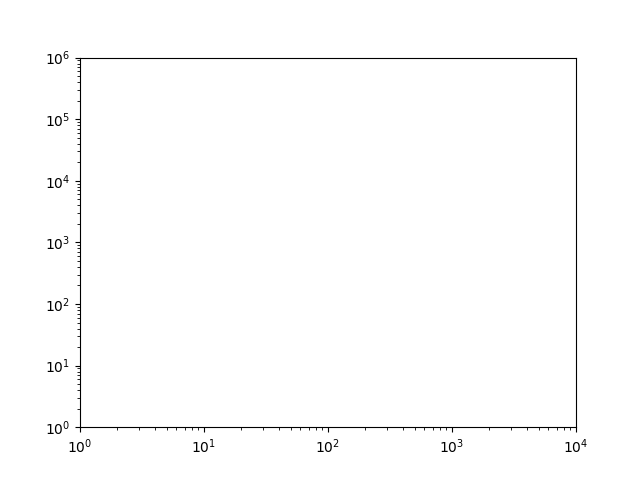
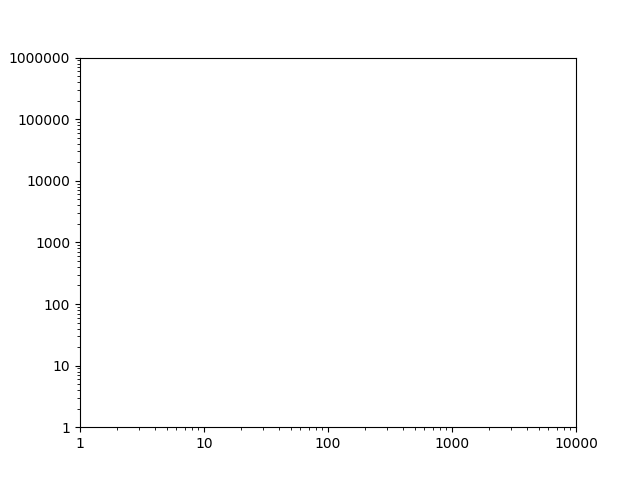
regarding these questions
What if I wanted to change the numbers to, 1, 5, 10, 20?
– aloha Jul 10 '15 at 13:26
I would like to add ticks in between, like 50,200, etc.., How can I do
that? I tried, set_xticks[50.0,200.0] but that doesn't seem to work!
– ThePredator Aug 3 '15 at 12:54
But with ax.axis([1, 100, 1, 100]), ScalarFormatter gives 1.0, 10.0, ... which is not what I desire. I want it to give integers...
– CPBL Dec 7 '15 at 20:22
you can solve those issue like this with MINOR formatter:
ax.yaxis.set_minor_formatter(matplotlib.ticker.ScalarFormatter())
ax.yaxis.set_minor_formatter(matplotlib.ticker.FormatStrFormatter("%.8f"))
ax.set_yticks([0.00000025, 0.00000015, 0.00000035])
in my application I'm using this format scheme, which I think solves most issues related to log scalar formatting; the same could be done for data > 1.0 or x axis formatting:
plt.ylabel('LOGARITHMIC PRICE SCALE')
plt.yscale('log')
ax.yaxis.set_major_formatter(matplotlib.ticker.ScalarFormatter())
ax.yaxis.set_major_formatter(matplotlib.ticker.FormatStrFormatter("%.8f"))
ax.yaxis.set_minor_formatter(matplotlib.ticker.ScalarFormatter())
ax.yaxis.set_minor_formatter(matplotlib.ticker.FormatStrFormatter("%.8f"))
#####################################################
#force 'autoscale'
#####################################################
yd = [] #matrix of y values from all lines on plot
for n in range(len(plt.gca().get_lines())):
        line = plt.gca().get_lines()[n]
        yd.append((line.get_ydata()).tolist())
yd = [item for sublist in yd for item in sublist]
ymin, ymax = np.min(yd), np.max(yd)
ax.set_ylim([0.9*ymin, 1.1*ymax])
#####################################################
z = []
for i in [0.0000001, 0.00000015, 0.00000025, 0.00000035,
          0.000001, 0.0000015, 0.0000025, 0.0000035,
          0.00001,  0.000015, 0.000025, 0.000035,
          0.0001, 0.00015, 0.00025, 0.00035,
          0.001, 0.0015, 0.0025, 0.0035,
          0.01, 0.015, 0.025, 0.035,
          0.1, 0.15, 0.25, 0.35]:

    if ymin<i<ymax:
        z.append(i)
        ax.set_yticks(z)
for comments on "force autoscale" see: Python matplotlib logarithmic autoscale
which yields:
![enter image description here]()
then to create a general use machine:
# user controls
#####################################################
sub_ticks = [10,11,12,14,16,18,22,25,35,45] # fill these midpoints
sub_range = [-8,8] # from 100000000 to 0.000000001
format = "%.8f" # standard float string formatting

# set scalar and string format floats
#####################################################
ax.yaxis.set_major_formatter(matplotlib.ticker.ScalarFormatter())
ax.yaxis.set_major_formatter(matplotlib.ticker.FormatStrFormatter(format))
ax.yaxis.set_minor_formatter(matplotlib.ticker.ScalarFormatter())
ax.yaxis.set_minor_formatter(matplotlib.ticker.FormatStrFormatter(format))

#force 'autoscale'
#####################################################
yd = [] #matrix of y values from all lines on plot
for n in range(len(plt.gca().get_lines())):
        line = plt.gca().get_lines()[n]
        yd.append((line.get_ydata()).tolist())
yd = [item for sublist in yd for item in sublist]
ymin, ymax = np.min(yd), np.max(yd)
ax.set_ylim([0.9*ymin, 1.1*ymax])

# add sub minor ticks
#####################################################
set_sub_formatter=[]
for i in sub_ticks:
    for j in range(sub_range[0],sub_range[1]):
        set_sub_formatter.append(i*10**j)
k = []
for l in set_sub_formatter:
    if ymin<l<ymax:
        k.append(l)
ax.set_yticks(k)
#####################################################
yields:
![enter image description here]()


