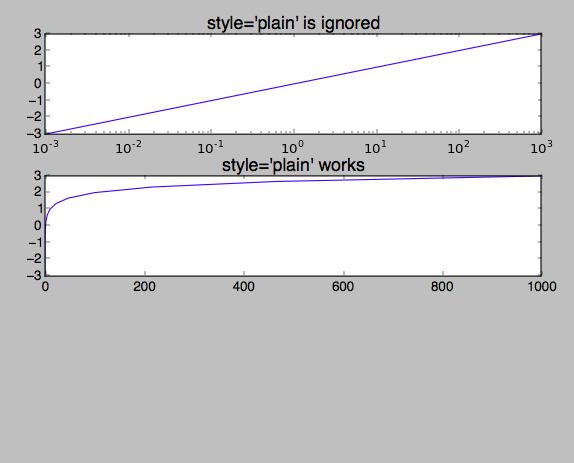
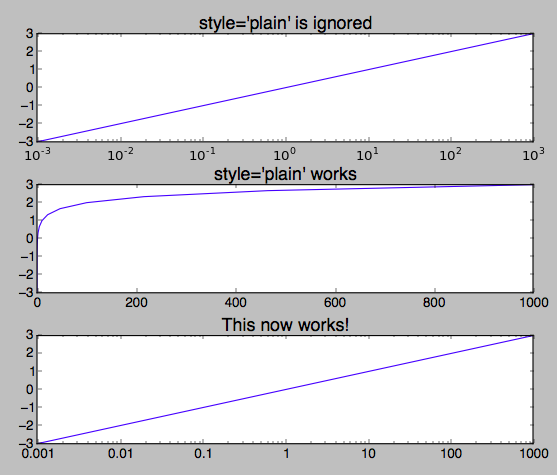
I would like to use ticklabel_format(style='plain') to suppress scientific notation on a logarithmic axis, but it is either ignored (first plot) or throws an exception (third plot, error shown below) depending on the order of the lines. It works however for a linear axis (second plot).
This happens both in versions 1.5.1 and 2.2.2 of Matplotlib.
Question: Why it it either ignored or fails for logarithmic axis and yet works fine for linear axis?
Traceback (most recent call last):
File "test.py", line 25, in <module>
ax3.ticklabel_format(style='plain', axis='x')
File "/Users/david/anaconda2/lib/python2.7/site-packages/matplotlib/axes/_base.py", line 2805, in ticklabel_format
"This method only works with the ScalarFormatter.")
AttributeError: This method only works with the ScalarFormatter.
Here is the plot:
import numpy as np
import matplotlib.pyplot as plt

x = np.logspace(-3, 3, 19)
y = np.log10(x)

fig = plt.figure()

ax1 = fig.add_subplot(3, 1, 1)
ax1.plot(x, y)
ax1.set_title("style='plain' is ignored", fontsize=16)
ax1.ticklabel_format(style='plain', axis='x')
ax1.set_xscale('log')

ax2 = fig.add_subplot(3, 1, 2)
ax2.plot(x, y)
ax2.set_title("style='plain' works", fontsize=16)
ax2.ticklabel_format(style='plain', axis='x')

if True:
    ax3 = fig.add_subplot(3, 1, 3)
    ax3.plot(x, y)
    ax3.set_title('THIS FAILS', fontsize=16)
    ax3.set_xscale('log')
    ax3.ticklabel_format(style='plain', axis='x')

plt.show()


LogFormatter. ThisLogFormatterdoes not have astyle='plain'argument. The solution is, as shown in the duplicate, to use aScalarFormatterinstead. – Jarplainis not supported by the formatter in use is clear enough from the error message,I would think.) – JarFooBarFormatter, would it change anything? Can the error message be made more clear? Where does a google search forScalarFormatterlead, and is this documentation sufficient enough? If not, what can we change? – Jar