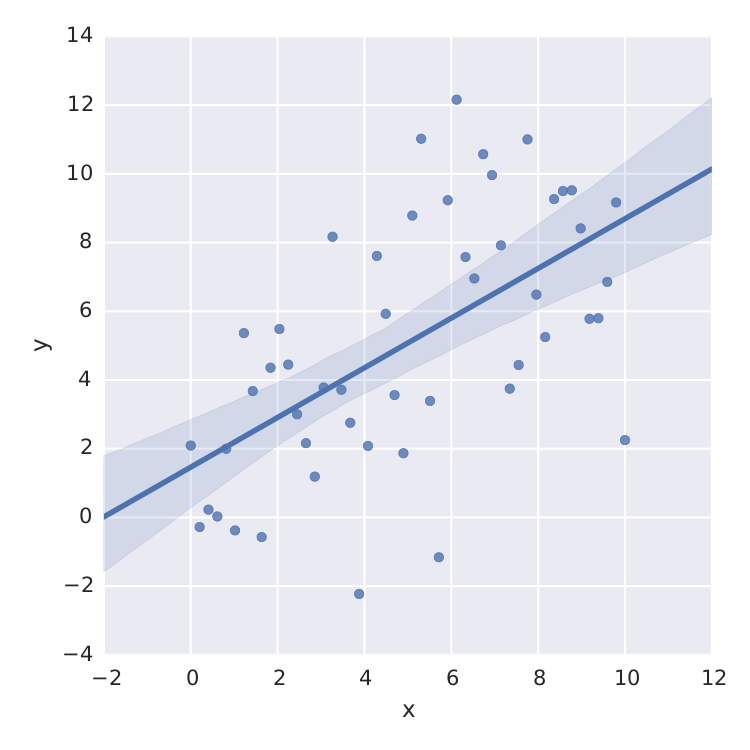
I have a sample time-series dataframe:
df = pd.DataFrame({'year':'1990','1991','1992','1993','1994','1995','1996',
                          '1997','1998','1999','2000'],
                   'count':[96,184,148,154,160,149,124,274,322,301,300]})
I want a linear regression line with confidence interval band in the regression line. Although I managed to plot a linear regression line. I am finding it difficult to plot the confidence interval band in the plot. Here is the snippet of my code for linear regression plot:
from matplotlib import ticker
from sklearn.linear_model import LinearRegression


X = df.date_ordinal.values.reshape(-1,1)
y = df['count'].values.reshape(-1, 1)

reg = LinearRegression()

reg.fit(X, y)

predictions = reg.predict(X.reshape(-1, 1))

fig, ax = plt.subplots()

plt.scatter(X, y, color ='blue',alpha=0.5)

plt.plot(X, predictions,alpha=0.5, color = 'black',label = r'$N$'+ '= {:.2f}t + {:.2e}\n'.format(reg.coef_[0][0],reg.intercept_[0]))


plt.ylabel('count($N$)');
plt.xlabel(r'Year(t)');
plt.legend()


formatter = ticker.ScalarFormatter(useMathText=True)
formatter.set_scientific(True)
formatter.set_powerlimits((-1,1))
ax.yaxis.set_major_formatter(formatter)


plt.xticks(ticks = df.date_ordinal[::5], labels = df.index.year[::5])


plt.grid()

plt.show()
plt.clf()
This gives me a nice linear regression plot for time series .
Problem & Desired output
However, I need confidence interval for the regression line too as in:.
Help on this issue would be highly appreciated.
