Python version: 3.6.4 (Anaconda on Windows) Seaborn: 0.8.1 Matplotlib: 2.1.2
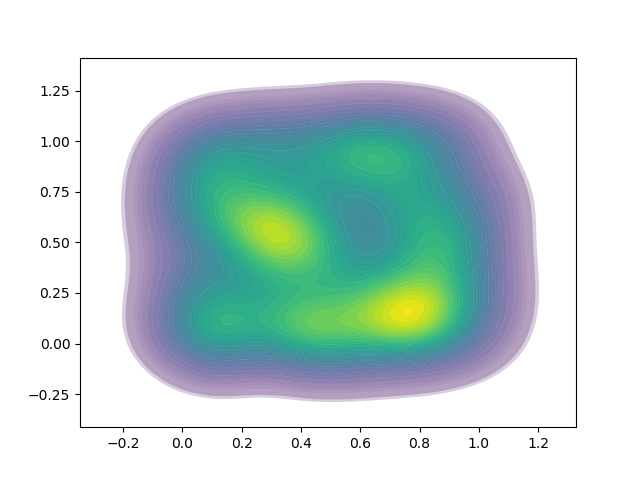
I'm trying to create a 2D Kernel Density plot using Seaborn but I want each step in the colourmap to have a different alpha value. I had a look at this question to create a matplotlib colourmap with alpha values: Add alpha to an existing matplotlib colormap.
I have a problem in that the lines between contours are visible. The result I get is here: 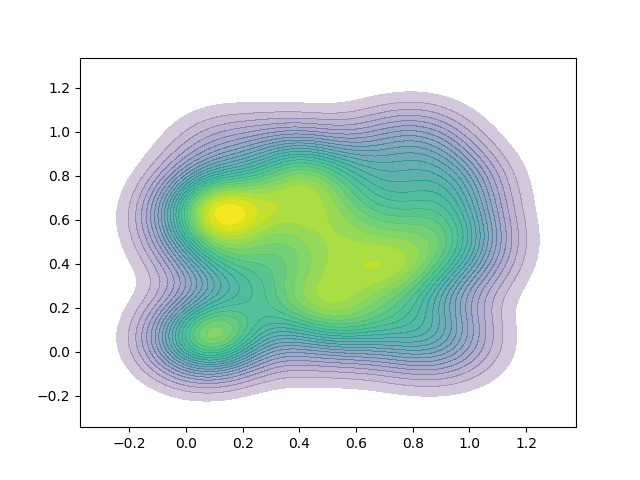
I thought that I had found the answer when I found this question: Hide contour linestroke on pyplot.contourf to get only fills. I tried the method outlined in the answer (using set_edgecolor("face") but it did not work in this case. That question also seemed to be related to vector graphics formats and I am just writing out a PNG.
Here is my script:
import numpy as np
import seaborn as sns
import matplotlib.colors as cols
import matplotlib.pyplot as plt

def alpha_cmap(cmap):
    my_cmap = cmap(np.arange(cmap.N))
    # Set a square root alpha.
    x = np.linspace(0, 1, cmap.N)
    my_cmap[:,-1] = x ** (0.5)
    my_cmap = cols.ListedColormap(my_cmap)

    return my_cmap

xs = np.random.uniform(size=100)
ys = np.random.uniform(size=100)

kplot = sns.kdeplot(data=xs, data2=ys,
                    cmap=alpha_cmap(plt.cm.viridis),
                    shade=True,
                    shade_lowest=False,
                    n_levels=30)

plt.savefig("example_plot.png")
Guided by some comments on this question I have tried some other methods that have been successful when this problem has come up. Based on this question (Matplotlib Contourf Plots Unwanted Outlines when Alpha < 1) I have tried altering the plot call to:
sns.kdeplot(data=xs, data2=ys,
            cmap=alpha_cmap(plt.cm.viridis),
            shade=True,
            shade_lowest=False,
            n_levels=30,
            antialiased=True)
With antialiased=True the lines between contours are replaced by a narrow white line:
I have also tried an approach similar to this question - Pyplot pcolormesh confused when alpha not 1. This approach is based on looping over the PathCollections in kplot.collections and tuning the parameters of the edges so that they become invisible. I have tried adding this code and tweaking the linewidth -
for thing in kplot.collections:
    thing.set_edgecolor("face")
    thing.set_linewidth(0.01)
fig.canvas.draw()
This results in a mix of white and dark lines - 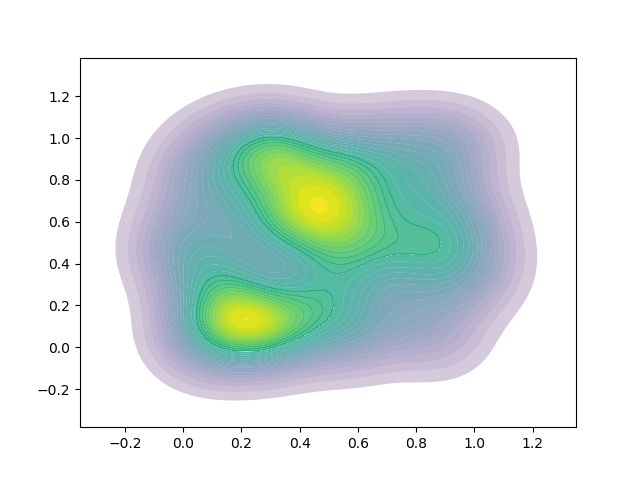 .
.
I believe that I will not be able to tune the line width to make the lines disappear because of the variable width of the contour bands.
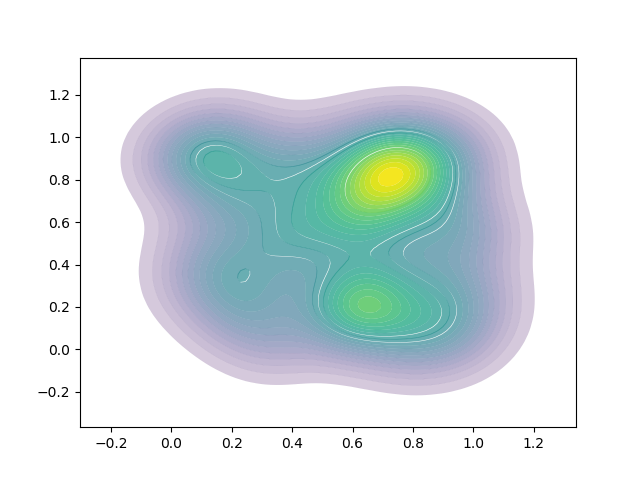
Using both methods (antialiasing + linewidth) makes this version, which looks cool but isn't quite what I want:
I also found this question - Changing Transparency of/Remove Contour Lines in Matplotlib
This one suggests overplotting a second plot with a different number of contour levels on the same axis, like:
kplot = sns.kdeplot(data=xs, data2=ys,
                    ax=ax,
                    cmap=alpha_cmap(plt.cm.viridis),
                    shade=True,
                    shade_lowest=False,
                    n_levels=30,
                    antialiased=True)

kplot = sns.kdeplot(data=xs, data2=ys,
                    ax=ax,
                    cmap=alpha_cmap(plt.cm.viridis),
                    shade=True,
                    shade_lowest=False,
                    n_levels=35,
                    antialiased=True)
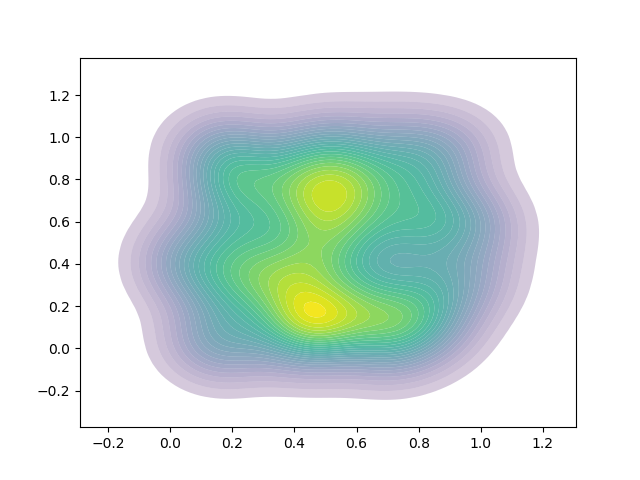
This is better, and almost works. The problem here is I need variable (and non-linear) alpha throughout the colourmap. The variable banding and lines seem to be a result of the combinations of alpha when contours are plotted over each other. I also still see some clear/white lines in the result.

PathCollectionsinkplot.collectionsand callset_edgecolor("face")andset_linewidth(0.000001). This gets closer, but the lines never disappear completely and sometimes the individual contours seem to start overlapping. – Againstlinewidth=0.0015625. There is also this question which proposesantialiased=True. For this userlinewidth=0.2seems enough. – Paly