Hide contour linestroke on pyplot.contourf to get only fills
Asked Answered
T

4

31

I have a pet project to create images of maps, where I draw the roads and other stuff over a contour plot of the terrain elevation. It is intended to plan mountain bike routes (I have made some vectorial drawings by hand, in the past, and they work great for visualization).

Currently, I download Digital Elevation Model, in GeoTIFF, from here: http://www.ecologia.ufrgs.br/labgeo/arquivos/downloads/dados/SRTM/geotiff/rs.rar

and then create the plot with GDAL and Matplotlib contourf function:

from osgeo import gdal
import matplotlib
import matplotlib.pyplot as plt
from pylab import cm
import numpy

f = 'rs.tif'

elev = gdal.Open(f)

a = elev.GetRasterBand(1).ReadAsArray()

w = elev.RasterXSize
h = elev.RasterYSize
print w, h

altura  = (0.35, 0.42)
largura = (0.70, 0.82)

a = a[int(h*altura[0]):int(h*altura[1]),
      int(w*largura[0]):int(w*largura[1])]


cont = plt.contourf(a, origin='upper', cmap=cm.gist_earth, levels=numpy.arange(0,1000,20))
plt.title('Altitudes - max: %d m; min: %d m' % (numpy.amax(a), numpy.amin(a)))
plt.show()

Which gives:

enter image description here

The problem is that contour lines are "white", and generate some visual pollution, which is undesired since I want to plot roads and rivers later.

So, I am trying to modify the way contourf create these lighter lines, either via parameter setting, or via hack (changing source code), similar to the one proposed here:

How to format contour lines from Matplotlib

Also, if anyone knows how to generate such a map in a more elegant way, using other libraries, I would appreciate the tip very much!

Thanks for reading.

Thetic answered 25/11, 2011 at 0:31 Comment(0)
B
61

I finally found a proper solution to this long-standing problem (currently in Matplotlib 3), which does not require multiple calls to contour or rasterize the figure.

Note that the problem illustrated in the question appears only in saved publication-quality figures formats like PDF, not in lower-quality raster files like PNG.

My solution was inspired by this answer, related to a similar problem with the colorbar. A similar solution turns out to solve the contour plot as well, as follows:

import numpy as np
import matplotlib.pyplot as plt

np.random.seed(123)
x, y = np.random.uniform(size=(100, 2)).T
z = np.exp(-x**2 - y**2)
levels = np.linspace(0, 1, 100)

cnt = plt.tricontourf(x, y, z, levels=levels, cmap="ocean")

# This is the fix for the white lines between contour levels
cnt.set_edgecolor("face")

plt.savefig("test.pdf")    

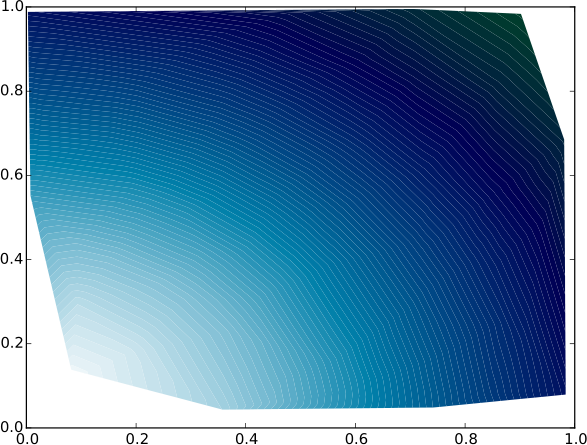
Here below is an example of contours before the fix

enter image description here

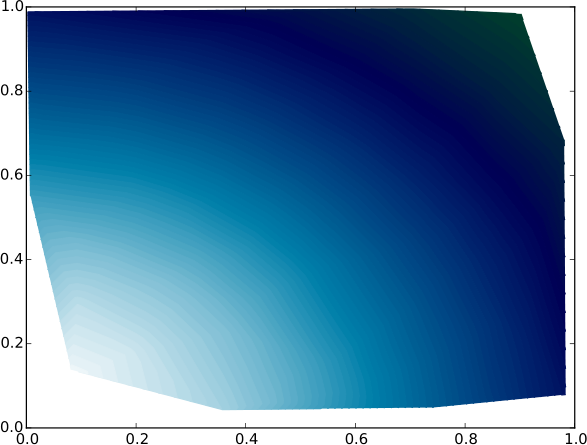
And here below is the same figure after the above fix

enter image description here

Binocular answered 2/10, 2015 at 16:3 Comment(5)
Well, of course this is now the accepted answer, as it plausibly and non-hackishly seems to solve the underlying problem. Thanks for posting even after so much time!!Thetic
Thanks @Thetic for updating it. The advantage of this solution is that it does not increase the file size and does not degrade image quality.Binocular
Awesome! I've been waiting for this, and I hope I won't forget to check my favourited posts next time I need it;)Ripping
Thanks so much! Will be using this on every contourf plot from now on. Surprised that it's only a 2-line solution.Gan
For me this leaves little white "slivers" where nothing is rendered in between levelsZurn
F
7

The solution to the problem, despite not being a real solution, but more a workaround, is simple: Just repeat the same contourf command and this will magically get rid of spurious contours.

As stated by the OP, spurious contours show up when doing contour fill (contourf) with intervals too close to each other. We can reproduce this behavior by setting a very large number of intervals, e.g.:

plt.contourf(plon,plat,ssh,np.arange(-1,1.001,0.001)) # 2001 intervals

This gives us as output:

enter image description here

The thin spurious contours obviously affect the net color of the contour fill.

If you do the command twice:

plt.contourf(plon,plat,ssh,np.arange(-1,1.001,0.001)) # Not once,
plt.contourf(plon,plat,ssh,np.arange(-1,1.001,0.001)) # but twice!

gives me:

enter image description here

Much better now. Here's the finest one, with 3 successive contourf commands:

enter image description here

I can't see any thin contours anymore! Unfortunately, this may slow down your scripts significantly, depending on array size and number of contour intervals. The spurious contours stand out more if more contour intervals are used. What usually works best for me is to use 50 to 100 contour intervals, and do the contourf twice.

Notice that the version of matplotlib I am using is not the latest one. This issue might have been resolved in version 1.1.0. If it has, please let me know.

Python 2.7.1 |EPD 7.0-2 (32-bit)| (r271:86832, Nov 29 2010, 13:52:51)
In [1]: matplotlib.__version__
Out[1]: '1.0.1'
Forta answered 17/5, 2012 at 19:59 Comment(7)
Thank you very much for your interest in an old question! I am pretty sure the problem is related to aliasing effects, with pixels not "colored right" at the borders. This agrees very much with your solution, since repainting semi-transparent (or semi-"uncolored") pixels tend to "fill them up" and make them colored. I cannot try this suggestion now, but for sure I will when the time comes (my plots are not so dense as to have prohibitive performance problems). Thanks!!Thetic
(and it is a shame the newest versions of ubuntu-related distros are still using matplotlib 0.9...)Thetic
@Thetic It is. I use Enthought Python Distribution on Fedora, RHEL and CentOS, and I would strongly recommend it. matplotlib 1.1.0 comes with it, among many other science-oriented modules. Apparently, I am not using the latest EPD version :). enthought.com/products/epd.php (I am not associated with Enthought)Forta
Looks like EPD must be paid for? If so, I think I'll stick with the not-so-old free cousins... :o(Thetic
@Thetic Sorry about that. EPD has a free version: enthought.com/products/epd_free.php, or a full version for free for academic use: enthought.com/products/edudownload.phpForta
A nice one, +1. As for the matplotlib version 1.1.0, it's a really easy install, at least on my by-now-quite old Lucid it's no problem at all.Moustache
If anyone gets as far as reading this comment, I solved the problems of old packages by starting to use easy_install and pip exclusively to install python packages. No more synaptic (on Linux), no more SourceForge compiled binaries (on Windows).Thetic
R
7

The posted solution did not work for me with alpha set to <1, but I found the answer in this solution: Matplotlib Contourf Plots Unwanted Outlines when Alpha < 1

Adding the argument antialiased=True solved the issue for me.

Rawlings answered 21/3, 2018 at 18:17 Comment(2)
I just upgraded to Matplotlib 2.2 and it is still working for me.Rawlings
Could you include a minimal working code and the figures you obtain, to be able to replicate what you did?Binocular
M
4

Try adding the kw argrument to plt.contourf(...) call: either lw=0 or ls=None. http://matplotlib.sourceforge.net/api/pyplot_api.html#matplotlib.pyplot.contourf

Moustache answered 25/11, 2011 at 10:48 Comment(6)
I did as you said, and I remembered trying something similar before, but unfortunately it didn't work. I am suspecting these lightstroke lines might be in fact a rendering issue due to improper anti-aliasing, but how could one know?Thetic
Honestly, I don't really know :-(. What is a little surprising though, is that in this example, matplotlib.sourceforge.net/examples/pylab_examples/…, the lines are not there. If I were you, I'd start from this example to see where do these lines start showing up.Moustache
Wow! Now that was surprising to see! Time to do homework now, as soon as I get some result, I'll come back with feedback. Many thanks!!!Thetic
Not so soon... I increased the plotting range in the cited example, getting a lot more contour lines. It looks like it happens when neighbour colors are too similar to each other, specially with deep blue. I think this is a subpixel antialiasing bug, so it seems I will have to apply some median filter to the image, by hand. Anyway, thanks for your help!Thetic
Before filtering the image, I'd try setting aliasing kwarg to the contourf, maybe it'll help.Moustache
New answer, seems to solve the problem, at least at the symptom if not at the cause.Thetic

© 2022 - 2024 — McMap. All rights reserved.