I have an issue creating axis tick labels that combine italic letters and input of variables. Simply said, I want to call variables and insert text such as n = 1 below each label.
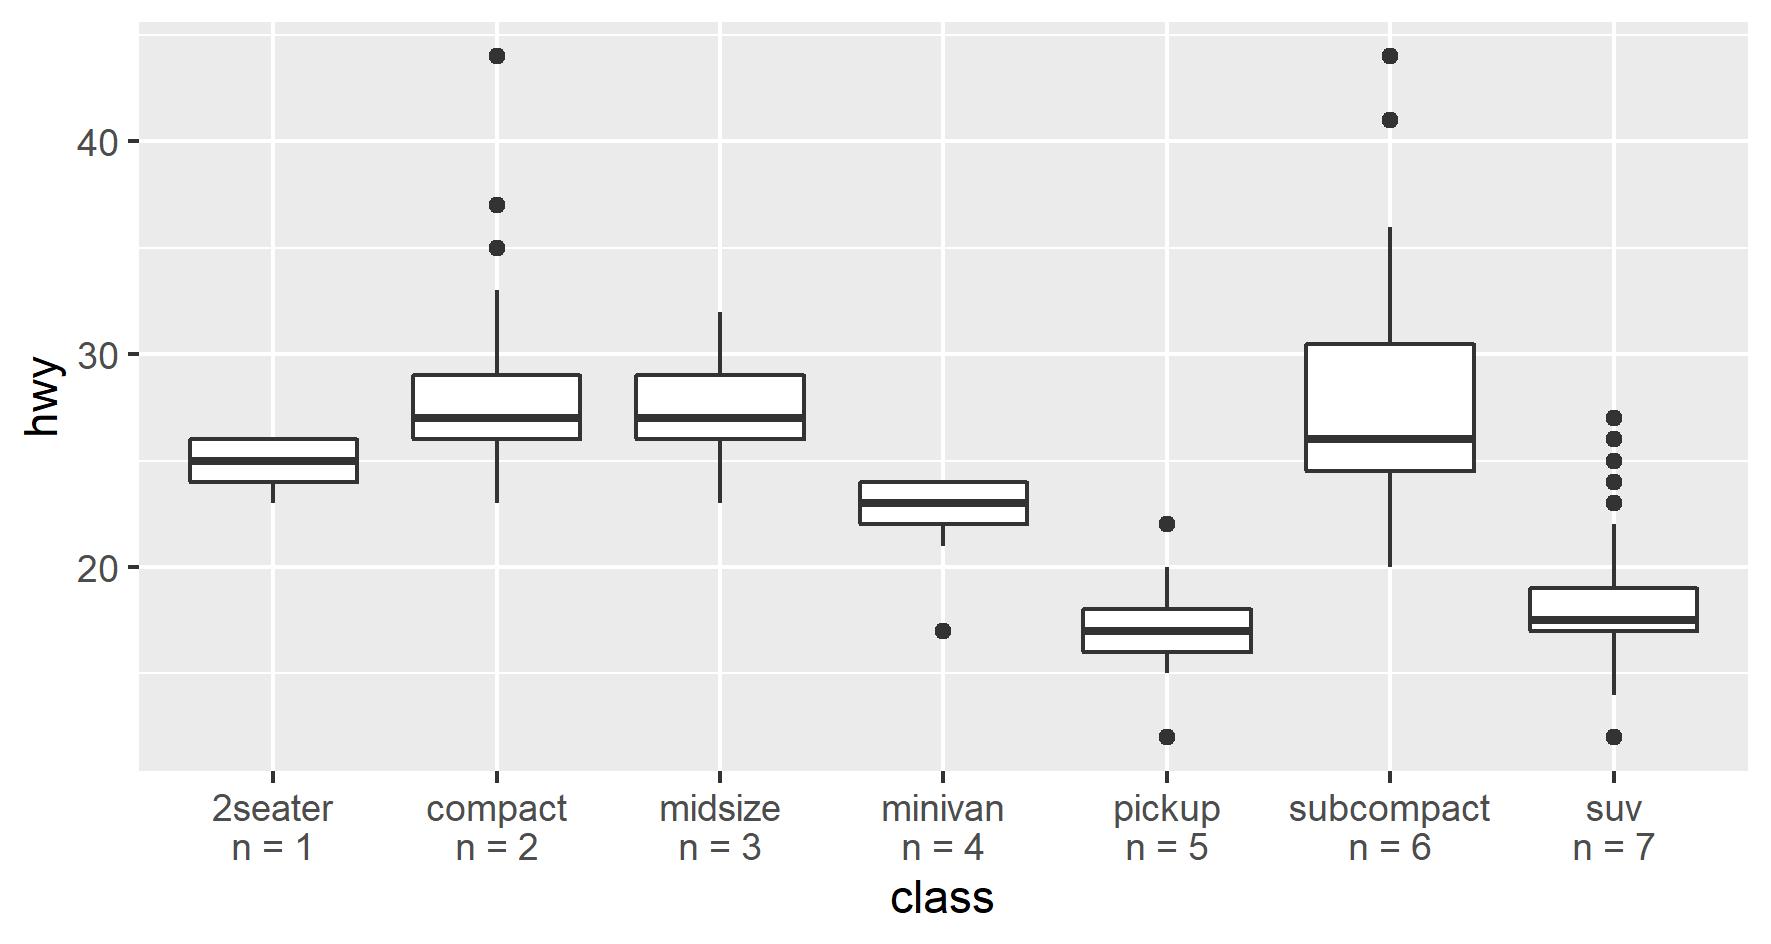
Here's an example with everything but the italic n:
require(ggplot2)

mpg$class <- as.factor(mpg$class)
counts <- rep(1:7, 1)

ggplot(mpg, aes(class, hwy)) +
  geom_boxplot() +
  scale_x_discrete(labels = paste(levels(mpg$class), "\nn = ", counts, sep = ""))
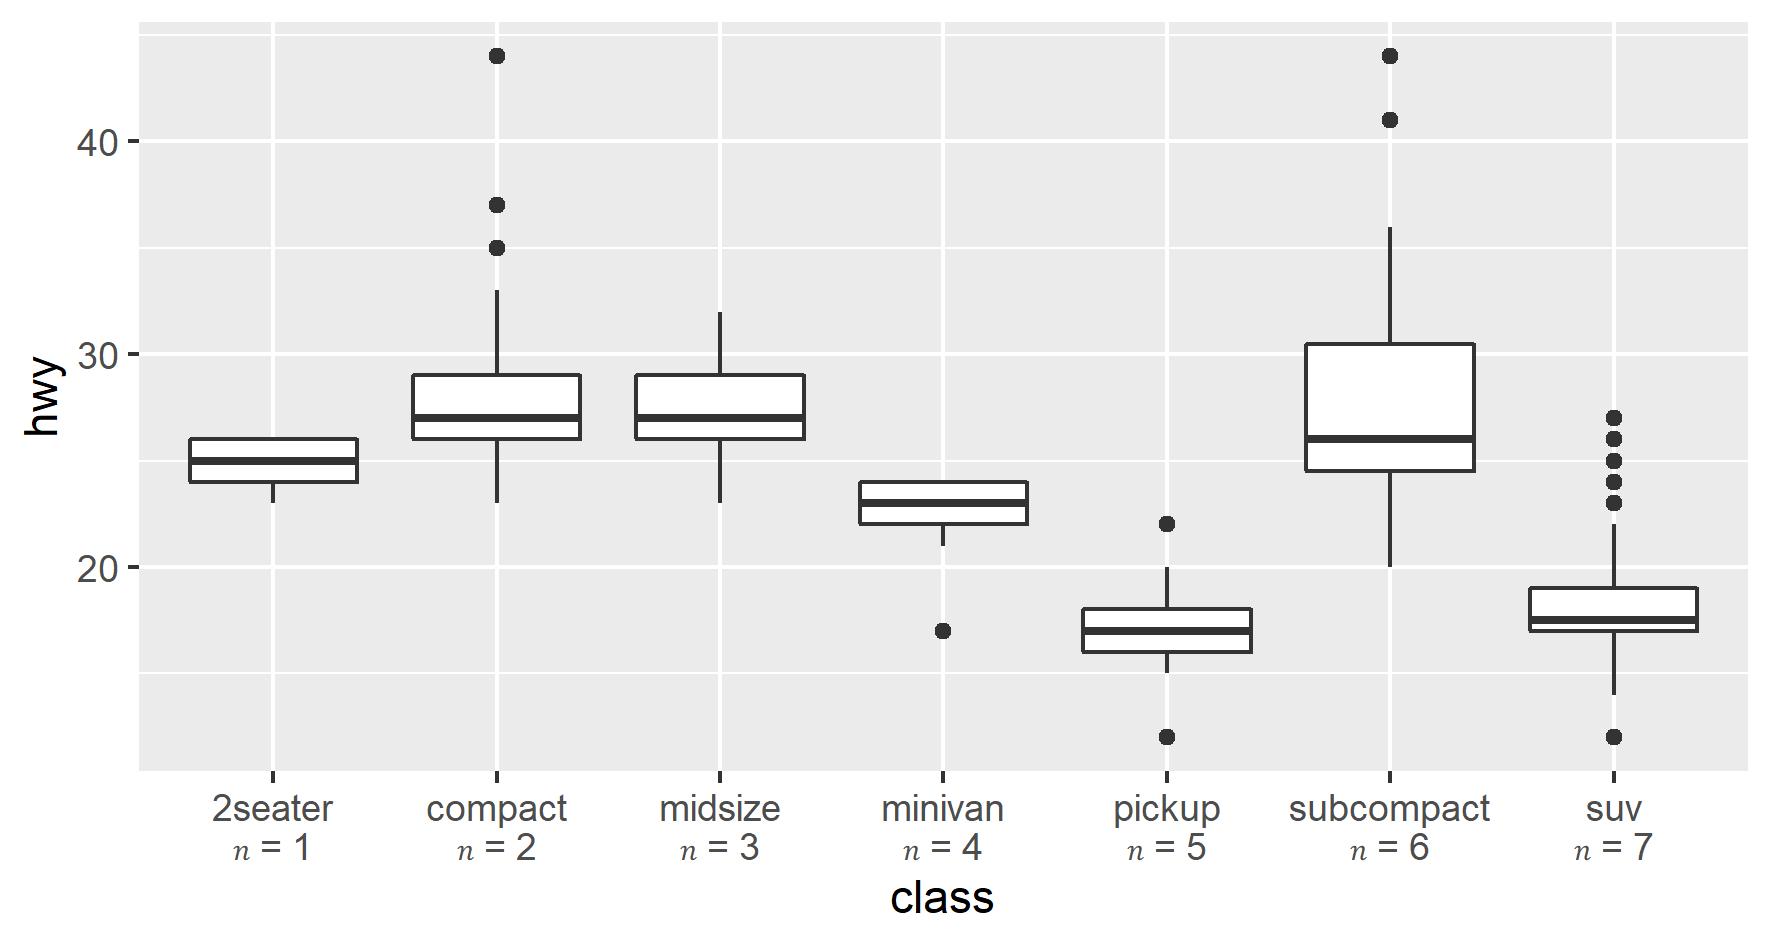
My first thought was to use the Unicode for an italic N, like I've done for superscript numbers in the past. But for some reason, the letter is too small & stylistically mismatched with the rest of the text. More importantly, in my real use-case, all Unicode characters for italic n appear to render out of alignment, depressed somewhere halfway between normal and subscript.
ggplot(mpg, aes(class, hwy)) +
  geom_boxplot() +
  scale_x_discrete(labels = paste(levels(mpg$class), "\n\U1D45B = ", counts, sep = ""))
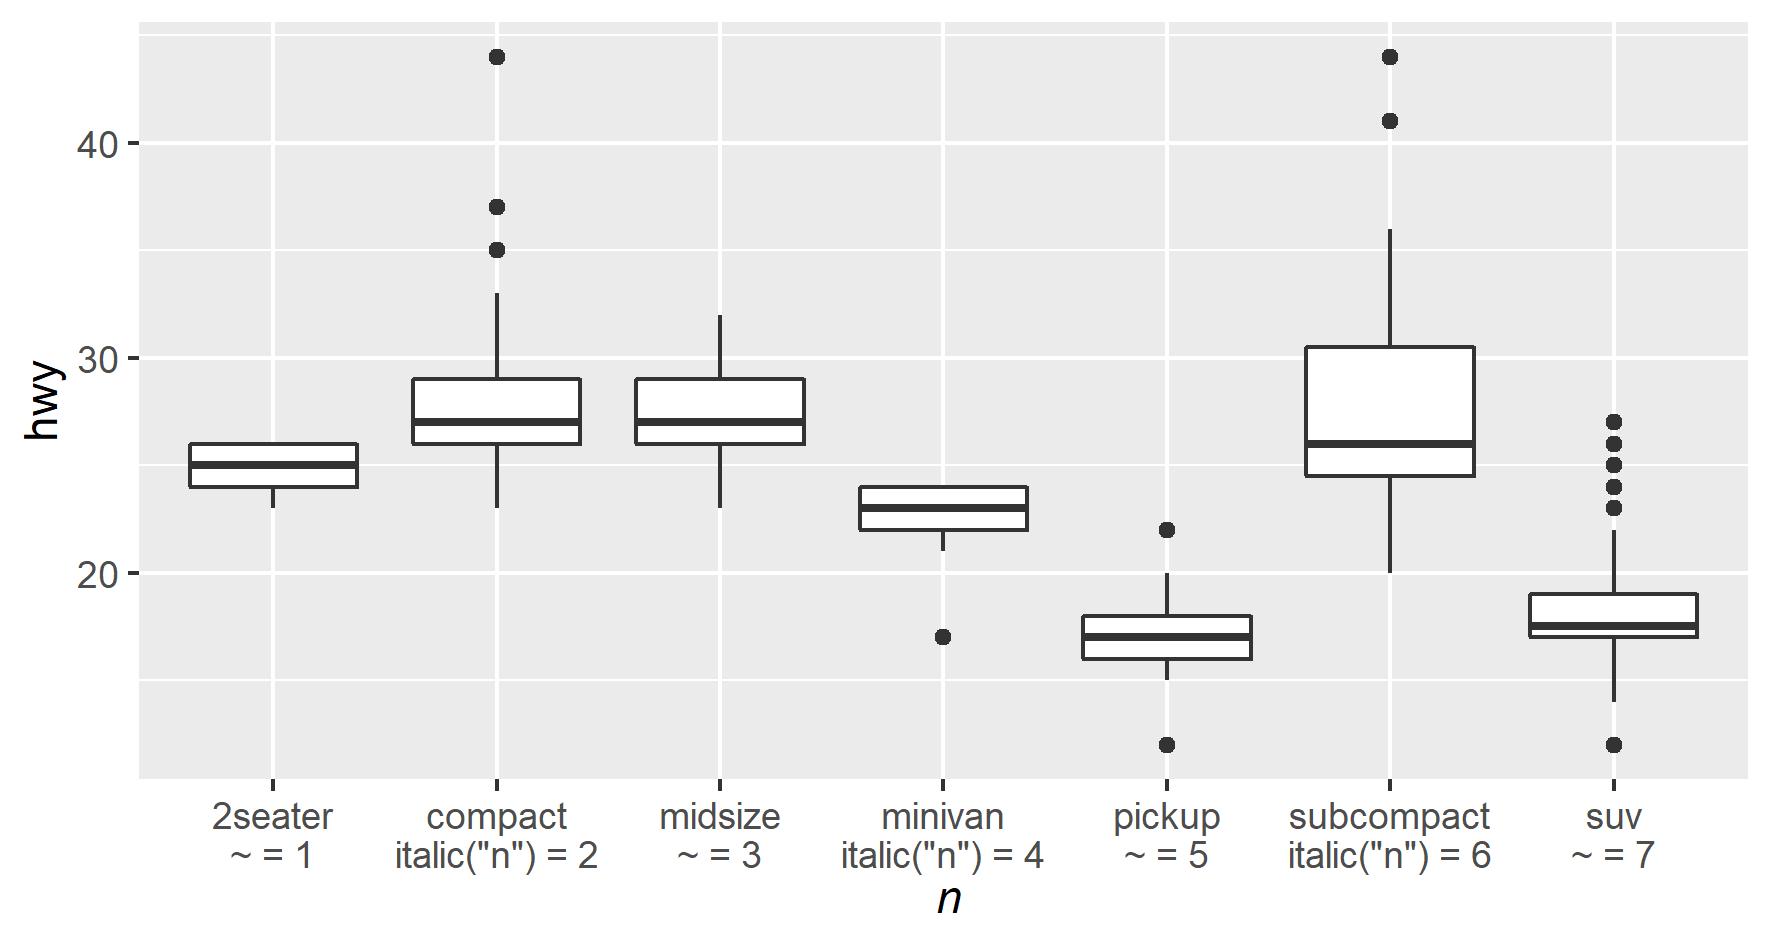
So, I found the plotmath function ~italic(x) could be used to italicize letters. However, there's a clear and unexpected failure when I incorporate it in the paste() line for the x-axis tick labels. Note that the function does work in xlab()
ggplot(mpg, aes(class, hwy)) +
  geom_boxplot() + xlab(~italic("n")) +
  scale_x_discrete(labels = paste(levels(mpg$class), "\n", ~italic("n"), " = ", counts, sep = ""))
I have searched StackOverflow for similar cases. However, none of them need to call for variables:
Add greek letters to axis tick labels in R
Changing one character in axis tick labels to italic while keeping multiple lines
How to change into italic style one letter in R plot without adding a space
How to italicize part (one or two words) of an axis title
I have tried understanding how to use expression() and bquote() while being able to call variables, but I have been unable to produce anything functional.
At this point, any help is very appreciated!


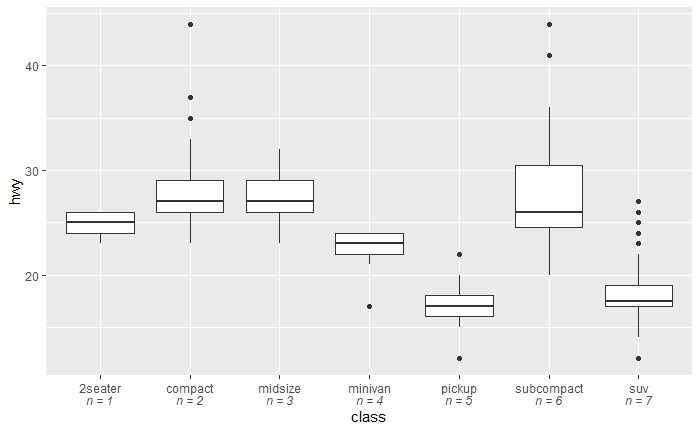
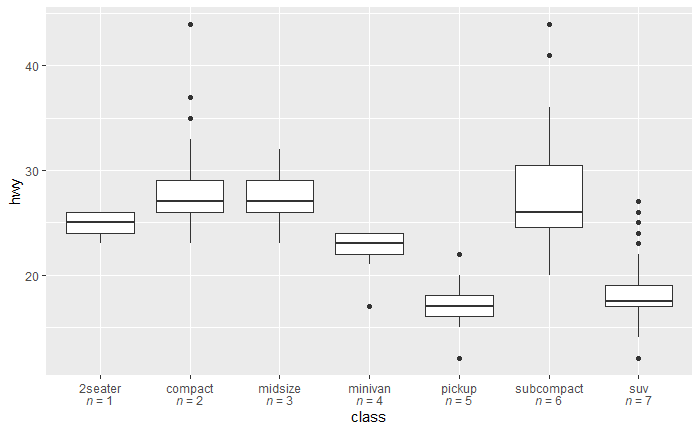
parse(text=sprintf('atop("%s", italic(n)==%s)', levels(mpg$class), counts))– Aletheaalethia