Changing one character in axis tick labels to italic while keeping multiple lines [duplicate]
Asked Answered
A

1

3

I have a geom_col from ggplot2 with labels for categorical axis ticks like below:Example
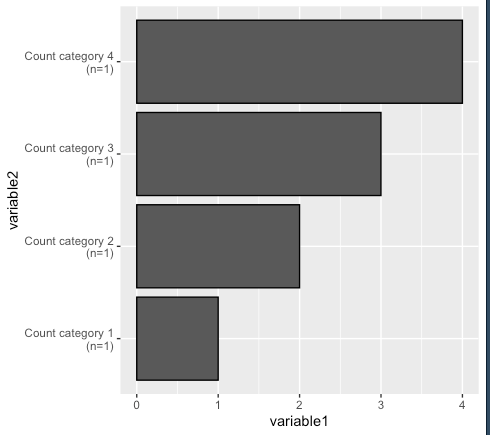
That plot was created with the following code:

library(tidyverse)

samplecounts=as.data.frame(c(1:4))
samplecounts$variable2=c("cat1","cat2","cat3","cat4")
names(samplecounts)[1]="variable1"

my.labels=c("Count category 1\n(n=1)","Count 2 of a different length\n(n=1)",
            "Countegory 3\n(n=1)","Count 4 cat\n(n=1)")

a=ggplot(data=samplecounts,aes(variable2,variable1))+
  geom_col(color='black')+
  scale_x_discrete(labels=my.labels) +
  coord_flip()
a

My goal is to italicize only the "n" character in each of the axis tick labels. I have seen solutions for doing this in the axis title. In this case, the axis title is "variable2". I am looking to change the axis tick labels, "Count category 4 (n=1), etc.".

Side note, the italics function does not exist in my current version of R. I am running R 4.0.2.

Allister answered 25/9, 2020 at 15:38 Comment(1)
#39282793 Maybe this helps youEllyellyn
T
4

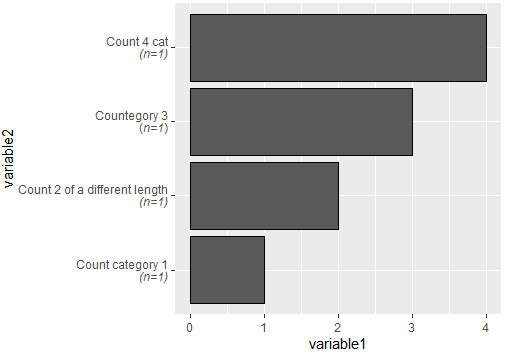
Try with ggtext package and adding ** to your text chains and using element_mardown() in your theme like this (Updated: In markdown language break lines use <br> instead on \n):

library(tidyverse)
library(ggtext)
#Data
samplecounts=as.data.frame(c(1:4))
samplecounts$variable2=c("cat1","cat2","cat3","cat4")
names(samplecounts)[1]="variable1"

my.labels=c("Count category 1<br>*(n=1)*","Count 2 of a different length<br>*(n=1)*",
            "Countegory 3<br>(*n=1*)","Count 4 cat<br>*(n=1)*")
#Plot
ggplot(data=samplecounts,aes(variable2,variable1))+
  geom_col(color='black')+
  scale_x_discrete(labels=my.labels) +
  theme(axis.text.y = element_markdown())+
  coord_flip()

Output:

enter image description here

Tachycardia answered 25/9, 2020 at 15:46 Comment(3)
The italic works but now the (n=1) portion is still on the same line as the category title. Notice the difference between the intended location of the multiple lines in the original plot and this plot?Allister
Found the solution in the documentation. <br> inserts a line break using ggtext as opposed to \n as shown in the code above.Allister
@coconn41 Updated now, you beat me in the comment. Check the new solution and let me know if that works :)Tachycardia

© 2022 - 2024 — McMap. All rights reserved.