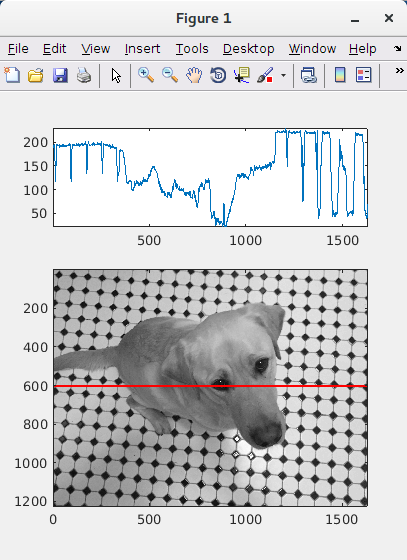
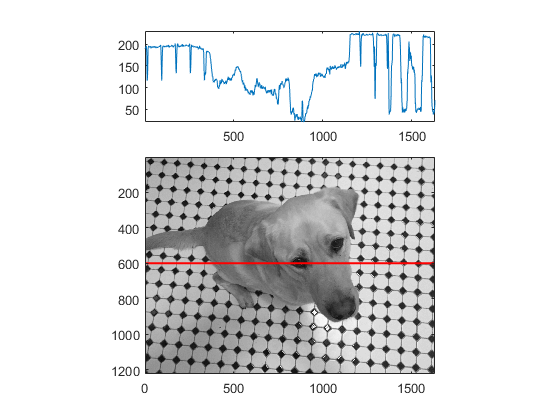
I have an image that I want to plot under a graph showing the intensity of an arbitrary row of this image.
Apparently, there is no way I can "automatically" make the two graphs both aligned (they share the same x-axis) and not distorted.
Here is a MWE that uses the kobi.png image that should come with MATLAB. For this solution I used the answer to this question, but it's not exactly what I am looking for. The reason will be clear after the code.
im = imread('kobi.png'); % read default image
img = rgb2gray(im); % convert to grayscale

y = 600; % select line to "scan"

% plot image with highlithed line
subplot(3,3,4:9);
imagesc(img);
colormap gray
hold on
line([0 size(img,2)], [y y], 'Color', 'r', 'LineWidth', 1.5);
hold off
axis image

photoAxs = gca;
photoAxsRatio = get(photoAxs,'PlotBoxAspectRatio');

% plot intensity of selected row
subplot(3,3,1:3);
r = img(y, :);
plot(r);
axis tight

topAxs = gca;

% adjust ratios
topAxsRatio = photoAxsRatio;
topAxsRatio(2) = photoAxsRatio(2)/2.4; % I want to get rid of this number!
set(topAxs,'PlotBoxAspectRatio', topAxsRatio)
As you can see, this produces (almost) the expected result, but there is an hardcoded number (that in the answer I linked was different, 3.8, while here is 2.4), that I would like to eliminate. Also, I think this number gives only an apparently aligned solution, but with my slight OCD this room for error gives me the creeps!
So the question is:
Is there any viable way to automatically align a graph and an image that have the same x-axis while maintaining the image aspect ratio?


