I've written a program that can be used to explore undocumented limitations of the RS in Intel processors in the hope that I'll be able to eventually answer the question. The basic idea is to make sure that the RS is completely empty before allocating and executing a specific sequence of uops in a loop. The RESOURCE_STALLS.RS can be used to determine whether that sequence has hit a limitation in the RS itself. For example, if RESOURCE_STALLS.RS is 1 per iteration, then the allocator had to stall for one cycle to allocate RS entries for all uops in the sequence. If RESOURCE_STALLS.RS is much smaller than 1 per iteration, then it basically did not have to stall and so we know we didn't not hit any of the RS limitations.
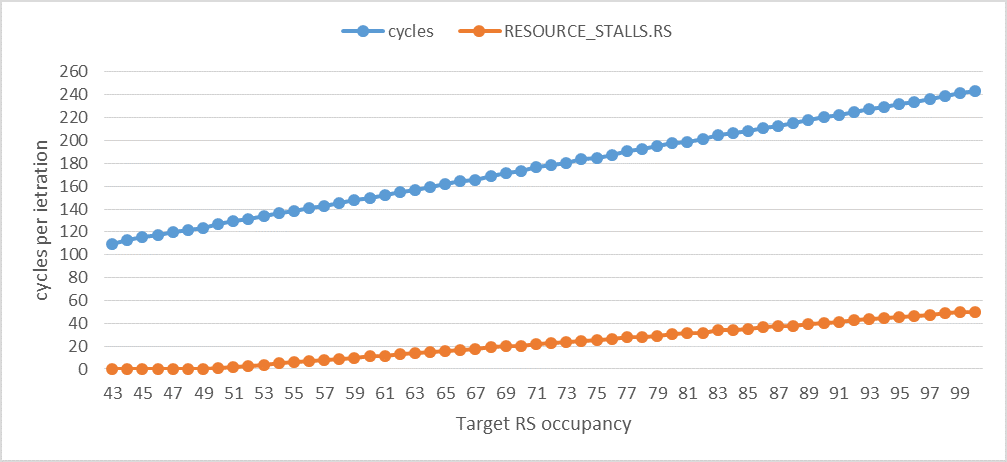
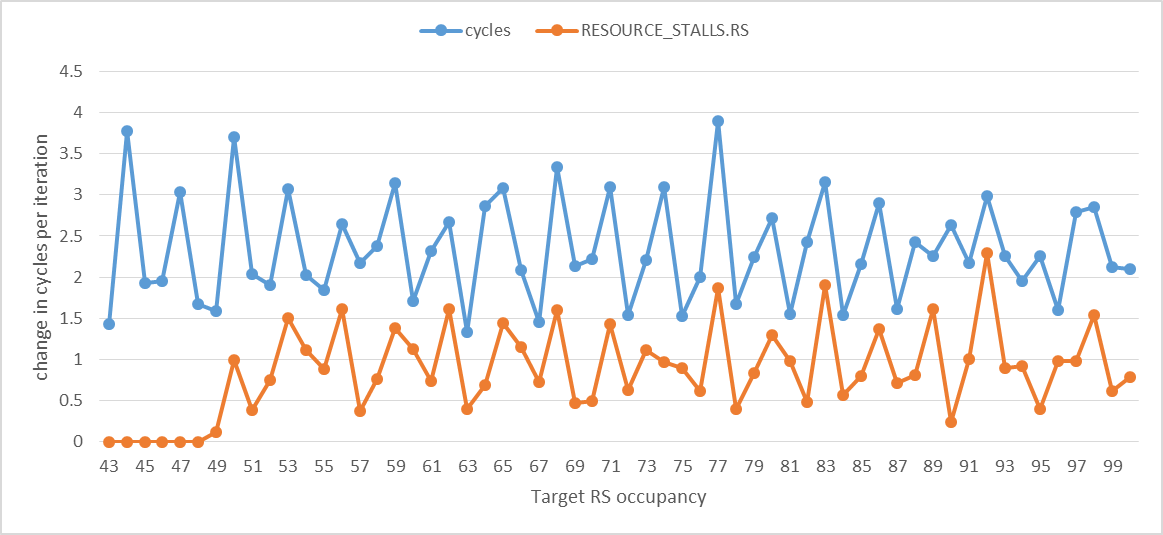
I've experimented with a sequence of dependent ADD instructions, a sequence of dependent BSWAP instructions, a sequence of dependent load instructions to the same location, a sequence of backward or forward unconditional jump instructions, and a sequence of store instructions to the same location. The following two graphs show the results for the sequence of add instructions for different target RS occupancies (the maximum number of RS entries that will be simultaneously required and occupied by the sequence of uops). All the values are shown per iteration.
The following graph shows that RESOURCE_STALLS.RS per iteration becomes at least (or anywhere near) 1 cycle per iteration when the RS occupancy is 50. Although it's not clearly visible, RESOURCE_STALLS.RS becomes larger than zero when the RS occupancy exceeds 43, but only exceeds 1 when the RS occupancy exceeds 49. In other words, I'm only able to simultaneously use up to 49 RS entries out of the 60 (in Haswell) without RS stalls. After that, RESOURCE_STALLS.RS increases on average by 1 per additional uop in the sequence, which is consistent with the bursty behavior of the allocator and the fact that each ADD uop can be completed every cycle (each uop occupies an RS entry for 1 cycle only). cycles increases on average by 2.3 per additional uop. It's larger than 1 per additional uop because there are also additional stalls on the ROB for reasons not related to the add uops, but these are OK because they do not impact RESOURCE_STALLS.RS.
![enter image description here]()
The following graph shows the change in cycles and RESOURCE_STALLS.RS per iteration. It illustrates the strong correlation between execution time and RS stalls.
![enter image description here]()
When the target RS occupancy is between 44-49, RESOURCE_STALLS.RS is very small but still not really zero. I have also noticed that the exact order in which different uops are presented to the allocator slightly impacts the RS occupancy that can be reached. I think this is an effect of the RS array write port allocation scheme mentioned in the Intel manual.
So what's up with the other 11 RS entries (Haswell's RS is supposed to have 60 entries)? The RESOURCE_STALLS.ANY performance event is the key to answer the question. I've updated the code I'm using to perform these experiments to test different kinds of loads:
- Loads that can be dispatched with speculative addresses to achieve 4 cycle L1D hit latency. This case is referred to as
loadspec.
- Loads that cannot be dispatched with speculative addresses. These have an L1D hit latency of 5 cycles on Haswell. This case is referred to as
loadnonspec.
- Loads that can be dispatched with speculative but incorrect addresses. These have an L1D hit latency of 9 cycles on Haswell. This case is referred to as
loadspecreplay.
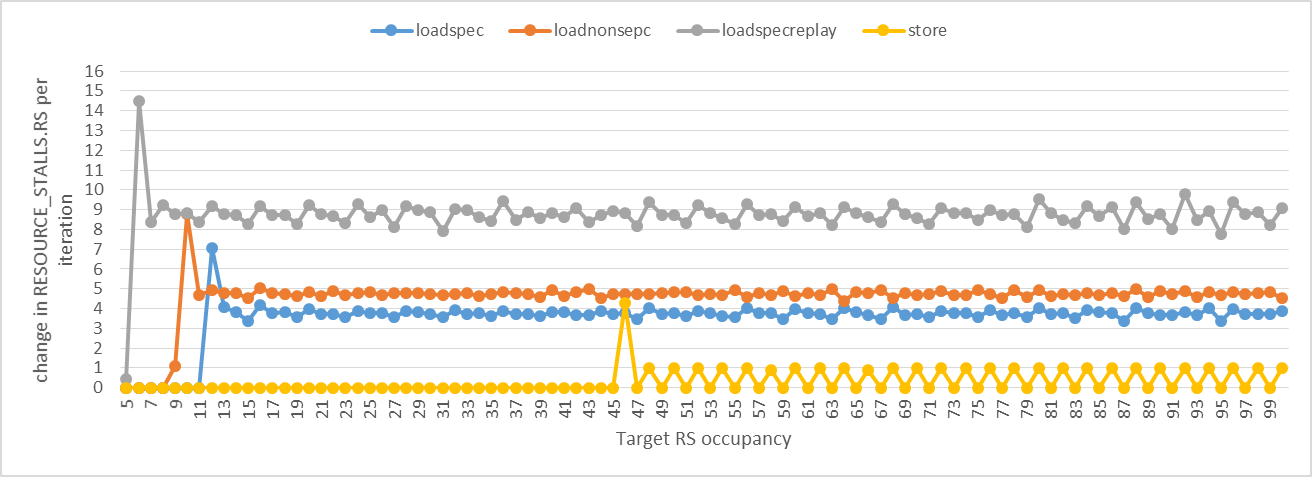
I followed the same approach with the ADD instructions, but this time we need to watch RESOURCE_STALLS.ANY instead of RESOURCE_STALLS.RS (which actually doesn't capture RS stalls due to loads). The following graph shows the change in cycles and RESOURCE_STALLS.ANY per iteration. The first spike indicates the the target RS occupancy has exceeded the available RS entries for that kind of uop. We can clearly see that for the loadspec case, there are exactly 11 RS entries for load uops! When the target RS occupancy exceeds 11, it takes on average 3.75 cycles for an RS entry to become free to the next load uop. This means that uops are deallocated from the RS when they complete, not when they get dispatched. This also explains how uop replay works. The spike for loadspecreplay occurs at RS occupancy 6. The spike for loadnonspec occurs at RS occupancy 9. As you will see later, these 11 entries are not dedicated for loads. Some of the 11 entries used by the loads may be among the 49 entries used by the ADD uops.
![enter image description here]()
I've also developed two test cases for stores: one that hits the limit of the store buffer and the other hits the limit of the RS. The graph above shows the former case. Note that a store needs two entries in the RS so the cases where the target RS occupancy is odd are the same as the previous even RS occupancies (change is zero). The graph shows that there can be up to 44/2 = 22 stores in the RS simultaneously. (The code I used to make the store graph had a bug in it that would make the achieved RS occupancy larger than what it is. After fixing it, the results show that there can be up to 20 stores in the RS simultaneously.) An entry occupied by a store-address or a store-data uop can be freed in one cycle. Intel says that the Haswell's store buffer has 42 entries, but I was not able to use all of these entries simultaneously. I'll probably have to design a different experiment to achieve that.
The jump sequences did not cause any stalls. I think this can be explained as follows: a jump uop frees the RS entry it occupies in one cycle and the allocator does not behave in a bursty way when it allocates jump uops. That is, every cycle one RS entry becomes free and the allocator will just allocate one jump uop without stalling. So we end up never stalling no matter how many jump uops there are. This is in contrast to add uops where the bursty allocator behavior makes it stall until the required number of RS entries become free (4 entries) even though the latency of an add uop is also one cycle. It makes sense that the jumps are allocated as soon as possible so that any mispredictions can be detected as early as possible. So if the allocator saw a jump and there is enough space in the RS for it but not later uops in its 4 uop group, then it would still allocate it. Otherwise, it might have to wait for potentially many cycles which can significantly delay the detection of mispredictions. This can be very costly
Is there an instruction whose uops can occupy all of the 60 entries of the RS simultaneously? Yes, one example is BSWAP. It requires two RS entries for its two uops and I can clearly see using RESOURCE_STALLS.RS that its uops can use all of the 60 entries of the RS simultaneously (assuming that my calculations are correct as to how the RS occupancy grows using the instruction). This proves that indeed there are exactly 60 entries in the RS. But there are constraints as to how they are used that we still don't know much about.


add, the basic assumption is that every 4 consecutive dependentaddinstructions increases the RS occupancy by 3, since 4 uops are going in, but 1 is going out (since they execute at 1 per cycle). Is that right? Overall it seems like a reasonable approach, but I think it also relies on a lot of assumptions, so some of the results may be explained by assumptions that don't hold. – Wardshipnopshitting the RAT never increment theRESOURCE_STALLScounter: assuming the RAT works by checking if there is space for 4 uops in the RS, and then taking ops to rename from the IDQ, it could be that even the stream ofnopinstructions will increment the counter at least until 4 spaces are available in the RS, which could inflate your count by 3 in theaddcase, for example. – Wardshipnopinstructions do behave in that way, I don't think it really explains fully any of the anomalous results. Also, I don't know how to "fix" it: if that's the way the RAT works any instruction would have that problem, unless you could perhaps stall the front-end at exactly the right moment (this seems hard). You could also try bracketing your test with a serializing instruction likecpuidrather than the existing approach of carefully calculated numbers of nops and see if the results are consistent. – Wardshipcpuidsince it has many uops and I don't understand fully how they all get executed and how much they may overlap with neighboring instructions. – Manhandle