I want to update a contourf plot within a function, which works fine.
However, the range of the data changes and I therefore also have to update the colorbar. That is where I fail to do so.
Please see following minimum working example:
import matplotlib.pyplot as plt
import numpy as np

fig = plt.figure()
ax = fig.add_subplot(111)

# Random data
data = np.random.rand(10, 10)

# Plot data
levels = np.linspace(0., 1., 100)
plot = ax.contourf(data, levels=levels)
clist = plot.collections[:]

# Create colorbar
cbar = plt.colorbar(plot)
cbar_ticks = np.linspace(0., 1., num=6, endpoint=True)
cbar.set_ticks(cbar_ticks)

plt.show()

def update():
    # Remove old plot
    for c in clist:
        ax.collections.remove(c)
        clist.remove(c)

    # Create new data and plot
    new_data   = 2.*np.random.rand(10, 10)
    new_levels = np.linspace(0., 2., 200)
    new_plot = ax.contourf(new_data, levels=new_levels )

    # Modify colorbar
    cbar.set_clim(0., 2.)
    new_cbar_ticks = np.linspace(0., 2., num=21, endpoint=True)
    cbar.set_ticks(new_cbar_ticks)

    plt.draw()

update()
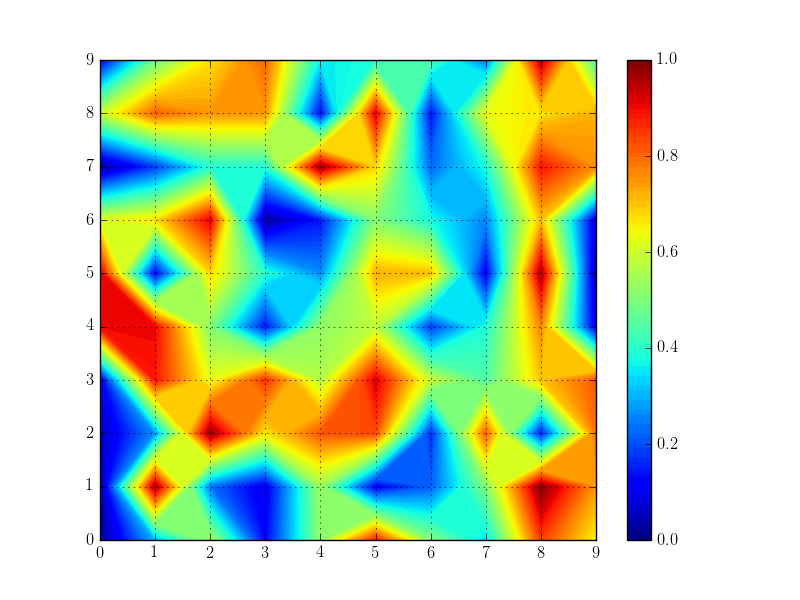
Without calling update() I get the following image:
This is exactly what I want.
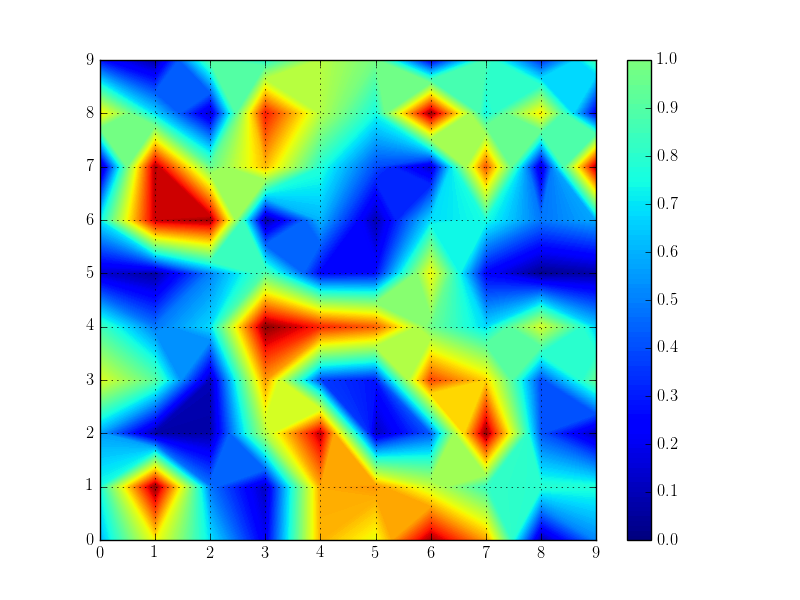
In the update() function I basically change the range of the data from [0,1) to [0,2), create new data, and update the plot. I also tried to double the sampling in the colorbar ticks to have ticks in an interval of 0.1, instead of 0.2. This is what I get:
The data is correctly plotted, the colormap of the data is correct, the ticks and the color in the colorbar are correct, but the range of the colorbar is still from 0 to 1. How can I change the colorbar to show the full range up to 2?


imshowdeal with polar coordinates? – Torytoryism