How do I pass an array of line specifications or styles to plot?
Asked Answered
D

1

0

I want to plot multiple lines with one call to plot(), with different line styles for each line. Here's an example:

Both

plot([1,2,3]', [4,5;6,7;8,9], {'-o', '-x'})

and

hs = plot([1,2,3]', [4,5;6,7;8,9])
set(hs, 'LineStyle', {'--'; '-'})

don't work. I've tried a whole bunch of arcane combinations with square and curly braces, but nothing seems to do the trick.

I know it's possible to loop through the columns in Y and call plot() for each one (like in this question), but that isn't what I'm after. I would really like to avoid using a loop here if possible.

Thanks.

PS: I found this 'prettyPlot' script which says it can do something like this, but I want to know if there's any built-in way of doing this.

PPS: For anyone who wants a quick solution to this, try this:

for i = 1:length(hs)
   set(hs(i), 'Marker', markers{i}); 
   set(hs(i), 'LineStyle', linestyles{i}); 
end

e.g. with markers = {'+','o','*','.','x','s','d','^','v','>','<','p','h'}

Dichromatism answered 15/10, 2016 at 11:32 Comment(0)
I
1

Referring to http://www.mathworks.com/help/matlab/ref/plot.html, this is how to draw multiple lines with a single plot command:

plot(X1,Y1,LineSpec1,...,Xn,Yn,LineSpecn)

So your idea of

plot([1,2,3]', [4,5;6,7;8,9], {'-o', '-x'})

must be written as:

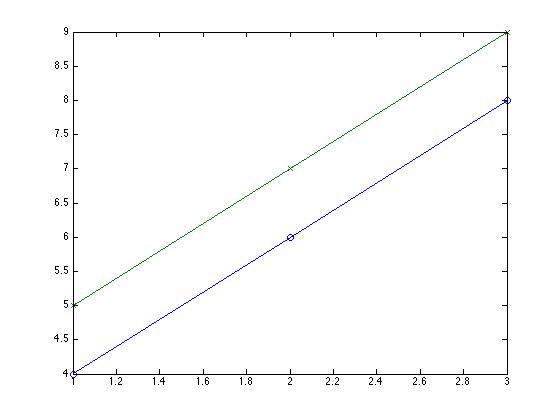
plot([1,2,3]', [4,6,8], '-o', [1,2,3]',[5,7,9],'-x')

resulting:

Multiple lines with single plot command

Reorganize input parameters into cell arrays and use cellfun to apply plot command to each cell element.

x = [1,2,3]';
xdata = {x;x};
ydata = {[4,6,8];[5,7,9]};    
lspec = {'-o';'-x'};

hold all;
cellfun(@plot,xdata,ydata,lspec);
Ixia answered 15/10, 2016 at 18:50 Comment(3)
Thanks for your answer. The example I gave in my question was just to show the form my data comes in, i.e. an array for X, a matrix for Y. These structures are usually really big, so manually splitting them up into separate arguments into plot() isn't really practical for me. Is there a way of passing in some sort of cell-array which magically unfolds into the parameter specification above?Dichromatism
How about reorganizing Y1 and use cellfun to iterate the plotting function. I've added an example to the answer.Ixia
Hey that's looking a lot better! Is there a way to permute/transform a regular i by j matrix into a cell array that looks like ydata above? Basically, to convert my numeric x array and y matrix into forms that will work with cellfun()Dichromatism

© 2022 - 2024 — McMap. All rights reserved.