I would like to plot multiple lines with MATLAB and do it so, that markers would be different in every line. I know that with colours this would be achieved with ColorSet = hsv(12);. Is there some as simple as this method for markers?
Well, I am not aware of a built-in functionality of MATLAB to do so, but I do the following. I create my own cell:
markers = {'+','o','*','.','x','s','d','^','v','>','<','p','h'}
and then access it this way:
markers{mod(i,numel(markers))+1}
I also created a function, getMarker, that does that and that I added to the path of MATLAB so that I can access it in all my scripts.
x = linspace(0, 2*pi);
y = cos(bsxfun(@plus, x(1:15:end), x'));
figure
m = {'+','o','*','.','x','s','d','^','v','>','<','p','h'};
set(gca(), 'LineStyleOrder',m, 'ColorOrder',[0 0 0], 'NextPlot','replacechildren')
plot(x, y)
Yes, there's a ready made method: it's the LineStyleOrder axis property. To activate it you have to disable the ColorOrder property, which takes precedence over the former and is activated by default. You can do as follows:
m = {'+','o','*','.','x','s','d','^','v','>','<','p','h'};
set_marker_order = @() set(gca(), ...
    'LineStyleOrder',m, 'ColorOrder',[0 0 0], ...
    'NextPlot','replacechildren');
where the m values were obtained manually from the output of help plot.
Then use it as in this example:
x = linspace(0, 2*pi);
y = cos(bsxfun(@plus, x(1:15:end), x'));
figure
set_marker_order()
plot(x, y)
The following also helps.
function testfig
x=0:0.1:10;
y1=sin(x);
y2=cos(x);
m = ['h','o','*','.','x','s','d','^','v','>','<','p','h'];

plot(x,y1,[m(1)])
hold on;
plot(x,y2,[m(2)])
I am using a simple procedure to randomly create new styles for plots. Though it is not really an iteration but someone may find it useful:
function [styleString] = GetRandomLineStyleForPlot()
% This function creates the random style for your plot
% Colors iterate over all colors except for white one
  markers = {'+','o','*','.','x','s','d','^','v','>','<','p','h'};
  lineStyles = {'-', '--', ':', '-.'};
  colors = {'y', 'm', 'c', 'r', 'g', 'b', 'k'};
  styleString = strcat(markers(randi(length(markers), 1) ), ...
                lineStyles(randi(length(lineStyles), 1) ), ...
                colors(randi(length(colors), 1) ) );

end
The easiest way, assuming you are using plot, is to add the type of line in the command.
Some of the possible options are: --,:,-,-.. There also options for the marker type and for the width.
For example this code will generate several lines with different types of markers:
x = -pi:.1:pi;
y = sin(x);
z = cos(x);
t = tan(x);
l = x.^2;
figure();
hold on;
plot (x,y,'--g');
plot (x,z,'-.y');
plot (x,t,'-b');
plot (x,l,':r');
hold off;
the generated graph is:

for more help go to: http://www.mathworks.com/help/techdoc/ref/linespec.html
set(h,'Marker',markers(j)); and keeping in mind that index j is smaller than markers table's size. But is there any ready build method to do this. –
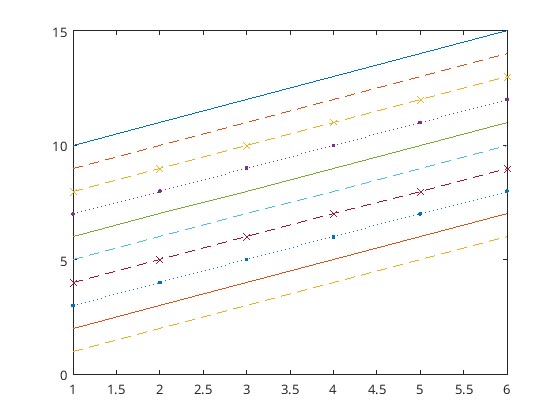
Gynecoid As of MATLAB R2024a, you can use the function linestyleorder to define a set of line styles and markers.
For example,
Y = (10:15)'- (0:9);
plot(Y);
linestyleorder(["-", "--", "--x", ":."]);
gives
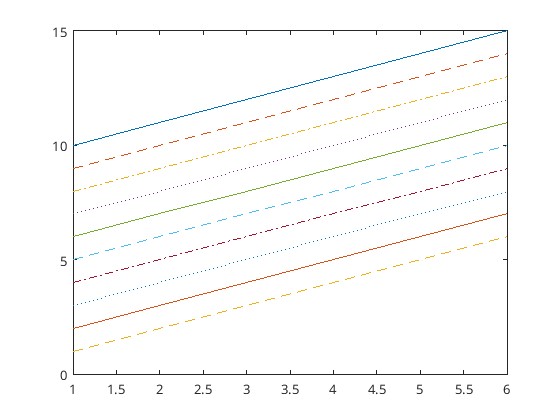
linestyleorder also comes with a set of predefined styles.
For example,
Y = (10:15)'- (0:9);
plot(Y);
linestyleorder("mixedstyles");
gives
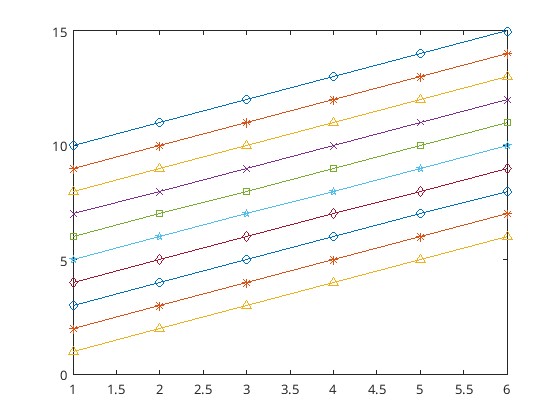
and
Y = (10:15)'- (0:9);
plot(Y);
linestyleorder("mixedmarkers");
gives
© 2022 - 2024 — McMap. All rights reserved.


