Save the console.log in Chrome to a file
Asked Answered
P

17

245

Does anyone know of a way to save the console.log output in Chrome to a file? Or how to copy the text out of the console?

Say you are running a few hours of functional tests and you've got thousands of lines of console.log output in Chrome. How do you save it or export it?

Prizefight answered 2/10, 2011 at 15:2 Comment(1)
See Export Javascript Console log from Google ChromePinfish
S
121

I needed to do the same thing and this is the solution I found:

  1. Enable logging from the command line using the flags:

    --enable-logging --v=1

This logs everything Chrome does internally, but it also logs all the console.log() messages as well. The log file is called chrome_debug.log and is located in the User Data Directory which can be overridden by supplying --user-data-dir=PATH (more info here).

  1. Filter the log file you get for lines with CONSOLE(\d+).

Note that console logs do not appear with --incognito.

Supersonic answered 9/4, 2012 at 1:43 Comment(22)
seems it doesn't work on my mac os, there are internal logs but no Console.log...Melanism
This doesn't save the console.log info to the log file. In Windows 8.Leander
I can't get this to work for console.log() messages either - under win7. I do see the file created, but it's chrome specific logging, not console related.Broadspectrum
If I want to dump an object, it's axactly what's n the console, not the actual content of the object i.e: [5984:2912:0209/160123:INFO:CONSOLE(55)] "[object Object],[object Object]", source: (55) ... So I guess I have to "dump manually" the whole object?Dorwin
@OlivierPons, have you tried passing the object to JSON.stringify() ? That will turn objects into strings.Estevez
Ok I did it and everything worked as expected (Windows 7 / Chrome 33.0.1750.146 m / Private mode) Thank you so much!Dorwin
If you're running linux and --enable-logging isn't working as anticipated, try --enable-logging=stderr. This should dump log information to (surprise...) stderr...Karlenekarlens
in my windows 7 the file chrome_debug.log goes to the parent folder of the one your link points to. User data instead of User data\defaultCairo
I'm getting a "Syntax Error" when I use this. Does this not work anymore? I'm putting this in the Console text field, next to the blue arrow. That the right place? ThanksBrahmi
@jaminroe it's parameters passed to chrome.exe. If you're on Windows, you can issue command %LOCALAPPDATA%\Google\Chrome\Application\chrome.exe --enable-logging --v=1 in cmd.exe.Flanker
On Mac I found the log file at ~/Library/Application Support/Google/Chrome/chrome_debug.logGay
This still works for me on OSX 10.10.3 /Applications/Google\ Chrome.app/Contents/MacOS/Google\ Chrome --enable-logging --v=1 with the log saved in ~/Library/Application Support/Google/Chrome/chrome_debug.logPacification
Mac 10.12.2 (Sierra). works for me as well, pretty much like @mateuscb. The log file is full of stuff, but the user js console stuff is in it, in entries like [23403:775:0116/185824:INFO:CONSOLE(1)] "coucou i am the user", source: (1).Speak
Is there any way to do this for chrome and not chromium?Aronoff
On Windows 10 I get Uncaught SyntaxError: Unexpected identifier, adardesign's answer worked for me.Remand
check out Sawbuck, I haven't tried it yet the description is that is a GUI for logging chrome.Agree
As JohnP2 says in his answer, --log-level=0 is a better choice than --v=1.Marienthal
I don't get anything other than the internal chrome logs. My console.log() lines are nowhere in that file. Anyone have a fix for this?Luker
What does --v=1 means? Is there something like --v=2 ?Tucket
June 2022, --enable-logging --v=1 confirmed to show console logs while --enable-logging --log-level=0 does not.Hershel
FYI the logs are formatted: [PROCESS_ID:THREAD_ID:MMDD/TIME:LOGGING_LEVEL:SOURCE_CODE_FILE_NAME(LINE_NUMBER)] LOG_MESSAGE see: support.google.com/chrome/a/answer/6271282?hl=enInterrupt
Works with Vivaldi too! Though, on macs, you need to look at ~/Library/Application Support/Vivaldi/chrome_debug.log.Speak
M
253

Good news

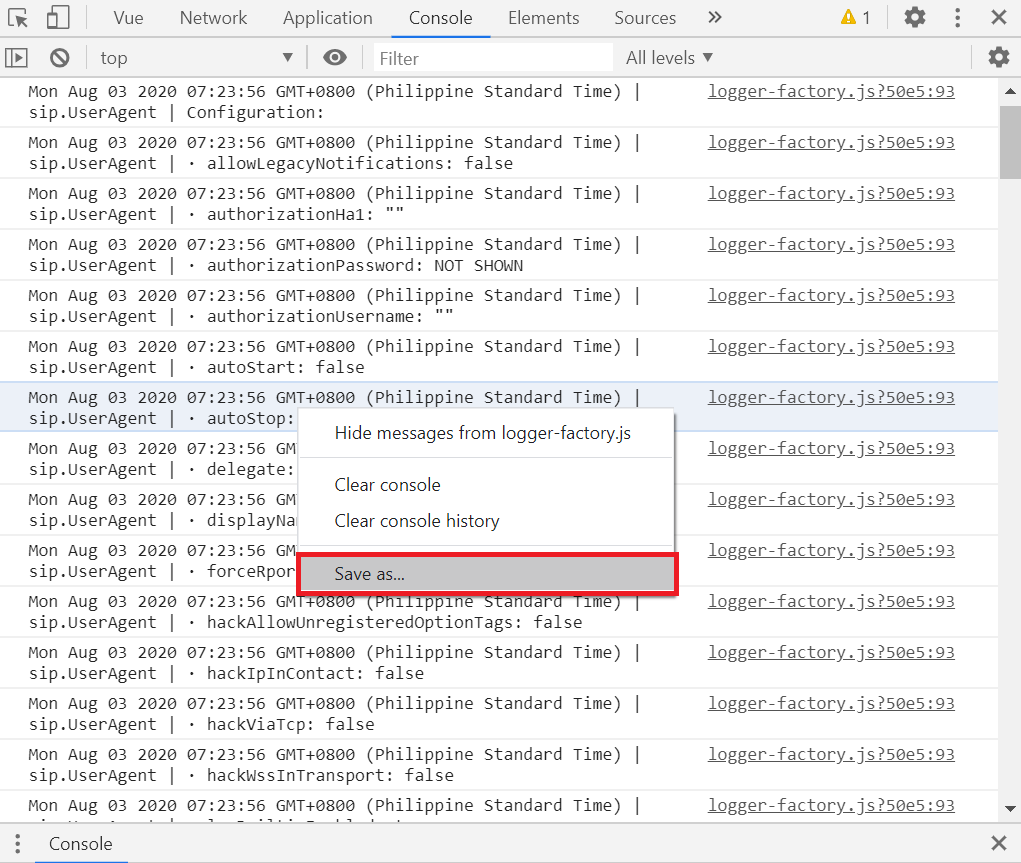
Chrome dev tools now allows you to save the console output to a file natively

  1. Open the console
  2. Right-click
  3. Select "save as.."

save console to file

Chrome Developer instructions here.

Maximo answered 25/6, 2015 at 20:0 Comment(11)
Can this be done using a keyboard shortcut or running a command on console?Armstead
Here is a list of all the devTools shortcuts developer.chrome.com/devtools/docs/shortcutsMaximo
Yeah but there's no such way to save console log using keyboard shortcut as per that.Armstead
Then there is no shortcut for this yet :( feel free to request it on crbug.comMaximo
This doesn't seem to copy the stack traceCasals
This also won't work to save messages if you're exceeding Chrome's console history sizeGenniegennifer
Can you open up that file in console again? If so, how do you so that?Stopcock
this doesnt save console.log output at all. What it actually does is only save every code that you had previously typed in the console screen.Pythian
Note that this won't expand objects - it'll still print large objects in their truncated form, e.g. {a: 1, b: 2, c: 3, ...}.Cellular
For some reason nothing happens when I click Save as... any ideas why?Auriga
how do we view the saved file in a same syntax format? @MaximoReentry
S
121

I needed to do the same thing and this is the solution I found:

  1. Enable logging from the command line using the flags:

    --enable-logging --v=1

This logs everything Chrome does internally, but it also logs all the console.log() messages as well. The log file is called chrome_debug.log and is located in the User Data Directory which can be overridden by supplying --user-data-dir=PATH (more info here).

  1. Filter the log file you get for lines with CONSOLE(\d+).

Note that console logs do not appear with --incognito.

Supersonic answered 9/4, 2012 at 1:43 Comment(22)
seems it doesn't work on my mac os, there are internal logs but no Console.log...Melanism
This doesn't save the console.log info to the log file. In Windows 8.Leander
I can't get this to work for console.log() messages either - under win7. I do see the file created, but it's chrome specific logging, not console related.Broadspectrum
If I want to dump an object, it's axactly what's n the console, not the actual content of the object i.e: [5984:2912:0209/160123:INFO:CONSOLE(55)] "[object Object],[object Object]", source: (55) ... So I guess I have to "dump manually" the whole object?Dorwin
@OlivierPons, have you tried passing the object to JSON.stringify() ? That will turn objects into strings.Estevez
Ok I did it and everything worked as expected (Windows 7 / Chrome 33.0.1750.146 m / Private mode) Thank you so much!Dorwin
If you're running linux and --enable-logging isn't working as anticipated, try --enable-logging=stderr. This should dump log information to (surprise...) stderr...Karlenekarlens
in my windows 7 the file chrome_debug.log goes to the parent folder of the one your link points to. User data instead of User data\defaultCairo
I'm getting a "Syntax Error" when I use this. Does this not work anymore? I'm putting this in the Console text field, next to the blue arrow. That the right place? ThanksBrahmi
@jaminroe it's parameters passed to chrome.exe. If you're on Windows, you can issue command %LOCALAPPDATA%\Google\Chrome\Application\chrome.exe --enable-logging --v=1 in cmd.exe.Flanker
On Mac I found the log file at ~/Library/Application Support/Google/Chrome/chrome_debug.logGay
This still works for me on OSX 10.10.3 /Applications/Google\ Chrome.app/Contents/MacOS/Google\ Chrome --enable-logging --v=1 with the log saved in ~/Library/Application Support/Google/Chrome/chrome_debug.logPacification
Mac 10.12.2 (Sierra). works for me as well, pretty much like @mateuscb. The log file is full of stuff, but the user js console stuff is in it, in entries like [23403:775:0116/185824:INFO:CONSOLE(1)] "coucou i am the user", source: (1).Speak
Is there any way to do this for chrome and not chromium?Aronoff
On Windows 10 I get Uncaught SyntaxError: Unexpected identifier, adardesign's answer worked for me.Remand
check out Sawbuck, I haven't tried it yet the description is that is a GUI for logging chrome.Agree
As JohnP2 says in his answer, --log-level=0 is a better choice than --v=1.Marienthal
I don't get anything other than the internal chrome logs. My console.log() lines are nowhere in that file. Anyone have a fix for this?Luker
What does --v=1 means? Is there something like --v=2 ?Tucket
June 2022, --enable-logging --v=1 confirmed to show console logs while --enable-logging --log-level=0 does not.Hershel
FYI the logs are formatted: [PROCESS_ID:THREAD_ID:MMDD/TIME:LOGGING_LEVEL:SOURCE_CODE_FILE_NAME(LINE_NUMBER)] LOG_MESSAGE see: support.google.com/chrome/a/answer/6271282?hl=enInterrupt
Works with Vivaldi too! Though, on macs, you need to look at ~/Library/Application Support/Vivaldi/chrome_debug.log.Speak
B
35

I have found a great and easy way for this.

  1. In the console - right click on the console logged object

  2. Click on 'Store as global variable'

  3. See the name of the new variable - e.g. it is variableName1

  4. Type in the console: JSON.stringify(variableName1)

  5. Copy the variable string content: e.g. {"a":1,"b":2,"c":3}

enter image description here

  1. Go to some JSON online editor: e.g. https://jsoneditoronline.org/

enter image description here

Bergerac answered 20/3, 2018 at 13:3 Comment(2)
Seems clunky on the surface but it works pretty well. In the later versions, at the bottom of the output there's a "Copy" button. I just press that, then have a small script that saves the clipboard as a .json file and opens in Visual Studio which is very readable. The only change is I do JSON.stringify(temp1, null, 2) to make it easier to read. The trick below to save the console works well as well.Thomajan
This answer doesn't work for long truncated textCoax
P
31

There is an open-source javascript plugin that does just that, but for any browser - debugout.js

Debugout.js records and save console.logs so your application can access them. Full disclosure, I wrote it. It formats different types appropriately, can handle nested objects and arrays, and can optionally put a timestamp next to each log. You can also toggle live-logging in one place, and without having to remove all your logging statements.

Planetary answered 17/6, 2014 at 17:49 Comment(4)
For reference, though this looks like a great tool, it will not capture output from the browser, like when image loads fail, or other built-in console output, and it requires that you rewrite your log statements using a special syntax.Metalworking
@Metalworking it certainly won't capture browser output (you would need a monkey patch to do that) but there is no special syntax needed. pass the same args as you would console.logPlanetary
@Inorganik I was searching for a way for selenium tests to capture console output, but it will be used for a testing service so we don't have control of the user's websites. I think your tool is cool, but it would require a user to rewrite their existing console.log statements as bugout.log, that's what I meant by special syntax. It appears so far that there is no cross-browser way to do it a this time.Metalworking
No, it won't work for us. We need to save log of result of testing of the complex website with big amount of 3rd party scripts, which runs on different domains and we can't change most of them.H
P
10

For better log file (without the Chrome-debug nonsense) use:

--enable-logging --log-level=0

instead of --v=1 which is just too much info.

It will still provide the errors and warnings like you would typically see in the Chrome console.

update May 18, 2020: Actually, I think this is no longer true. I couldn't find the console messages within whatever this logging level is.

Parachronism answered 10/4, 2017 at 23:24 Comment(2)
Uncaught SyntaxError: Unexpected identifierWhoever
June 2022, --enable-logging --v=1 confirmed to show console logs while --enable-logging --log-level=0 does not.Hershel
B
7

This may or may not be helpful but on Windows you can read the console log using Event Tracing for Windows

http://msdn.microsoft.com/en-us/library/ms751538.aspx

Our integration tests are run in .NET so I use this method to add the console log to our test output. I've made a sample console project to demonstrate here: https://github.com/jkells/chrome-trace

--enable-logging --v=1 doesn't seem to work on the latest version of Chrome.

Bakery answered 4/10, 2013 at 5:21 Comment(0)
B
7

For Google Chrome Version 84.0.4147.105 and higher,

just right click and click 'Save as' and 'Save'

then, txt file will be saved

enter image description here

Betulaceous answered 2/8, 2020 at 23:32 Comment(1)
This answer doesn't work for long truncated textCoax
S
5

A lot of good answers but why not just use JSON.stringify(your_variable) ? Then take the contents via copy and paste (remove outer quotes). I posted this same answer also at: How to save the output of a console.log(object) to a file?

Still answered 6/4, 2017 at 21:13 Comment(1)
For issues about "Uncaught TypeError: Converting circular structure to JSON", maybe this could help.Selfforgetful
M
3

There is another open-source tool which allows you to save all console.log output in a file on your server - JS LogFlush (plug!).

JS LogFlush is an integrated JavaScript logging solution which include:

  • cross-browser UI-less replacement of console.log - on client side.
  • log storage system - on server side.

Demo

Maemaeander answered 16/9, 2014 at 14:55 Comment(0)
C
3

If you're running an Apache server on your localhost (don't do this on a production server), you can also post the results to a script instead of writing it to console.

So instead of console.log, you can write:

JSONP('http://localhost/save.php', {fn: 'filename.txt', data: json});

Then save.php can do this

<?php

 $fn = $_REQUEST['fn'];
 $data = $_REQUEST['data'];

 file_put_contents("path/$fn", $data);
Calia answered 17/7, 2015 at 13:27 Comment(4)
I truly hope no one ever uploads this to a server in production 🙁. This is wrought with danger to the server.Glyceryl
Did you not read the first line: "If you're running an Apache server on your localhost"?Calia
Your down vote of my post is not justified because that would be incredibly foolish for someone to run a production server on "localhost" (where the JSONP requests posts data).Calia
I never down voted your answer, I merely pointed out the danger this script poses if ever uploaded to a server available to the public.Glyceryl
K
3
  1. Right-click directly on the logged value you want to copy
  2. In the right-click menu, select "Store as global variable"
  3. You'll see the value saved as something like "temp1" on the next line in the console
  4. In the console, type copy(temp1) and hit return (replace temp1 with the variable name from the previous step). Now the logged value is copied to your clipboard.
  5. Paste the values to wherever you want

This is especially good as an approach if you don't want to mess with changing flags/settings in Chrome and don't want to deal with JSON stringifying and parsing etc.

Update: I just found this explanation of what I suggested with images that's easier to follow https://scottwhittaker.net/chrome-devtools/2016/02/29/chrome-devtools-copy-object.html

Krouse answered 27/4, 2021 at 22:8 Comment(0)
G
2

These days it's very easy - right click any item displayed in the console log and select save as and save the whole log output to a file on your computer.

Gusto answered 21/2, 2019 at 18:27 Comment(0)
M
2

On Linux (at least) you can set CHROME_LOG_FILE in the environment to have chrome write a log of the Console activity to the named file each time it runs. The log is overwritten every time chrome starts. This way, if you have an automated session that runs chrome, you don't have a to change the way chrome is started, and the log is there after the session ends.

export CHROME_LOG_FILE=chrome.log

Mancini answered 10/2, 2020 at 17:13 Comment(0)
M
1

the other solutions in this thread weren't working on my mac. Here's a logger that saves a string representation intermittently using ajax. use it with console.save instead of console.log

var logFileString="";
var maxLogLength=1024*128;

console.save=function(){
  var logArgs={};

  for(var i=0; i<arguments.length; i++) logArgs['arg'+i]=arguments[i];
  console.log(logArgs);

  // keep a string representation of every log
  logFileString+=JSON.stringify(logArgs,null,2)+'\n';

  // save the string representation when it gets big
  if(logFileString.length>maxLogLength){
    // send a copy in case race conditions change it mid-save
    saveLog(logFileString);
    logFileString="";
  }
};

depending on what you need, you can save that string or just console.log it and copy and paste. here's an ajax for you in case you want to save it:

function saveLog(data){
  // do some ajax stuff with data.
  var xhttp = new XMLHttpRequest();

  xhttp.onreadystatechange = function(){
    if (this.readyState == 4 && this.status == 200) {}
  }

  xhttp.open("POST", 'saveLog.php', true);
  xhttp.send(data);
}

the saveLog.php should append the data to a log file somewhere. I didn't need that part so I'm not including it here. :)

https://www.google.com/search?q=php+append+to+log

Maureen answered 1/3, 2020 at 9:1 Comment(0)
C
1

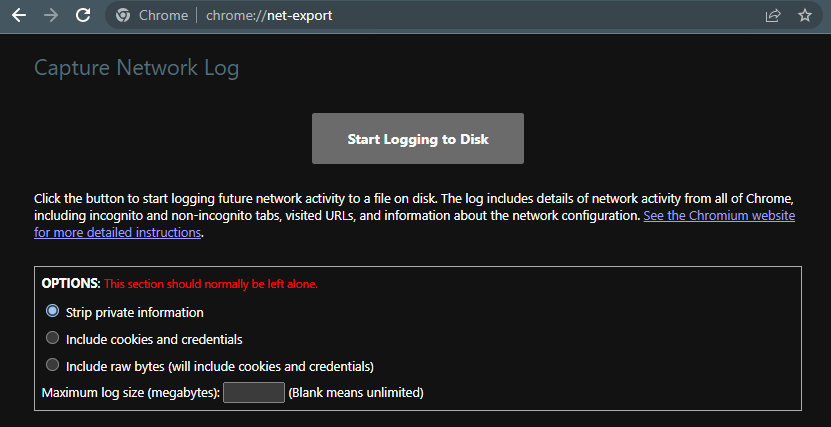
This answer might seem specifically related, but specifically for Network Log, you can visit the following link.

The reason I've post this answer is because in my case, the console.log printed a long truncated text so I couldn't get the value from the console. I solved by getting the api response I was printing directly from the network log.

chrome://net-export/

There you may see a similar windows to this, just press the Start Logging to Disk button and that's it:

enter image description here

Coax answered 8/4, 2022 at 15:14 Comment(0)
R
1

One approch is to convert results into string and convert that string data to blob and then to data url and make it downloadable using <a> tag and click()

// Convert string data to url
var results = { test1: 'result1', test2: 'result2' }
let blob = new Blob([JSON.stringify(results)], {type: 'text/plain'})
let url = URL.createObjectURL(blob)

// Create anchor tag
let downloadLink = document.createElement('a')
downloadLink.download = 'results.txt'
downloadLink.href = url

// Click to download file
downloadLink.click()
Recalescence answered 22/5, 2023 at 4:24 Comment(0)
M
0

Create a batch file using below command and save it as ChromeDebug.bat in your desktop.

start chrome --enable-logging --v=1

Close all other Chrome tabs and windows. Double click ChromeDebug.bat file which will open Chrome and a command prompt with Chrome icon in taskbar. All the web application logs will be stored in below path. Run the below path in Run command to open chrome log file

%LocalAppData%\Google\Chrome\User Data\chrome_debug.log

Mercantilism answered 7/7, 2022 at 19:46 Comment(0)

© 2022 - 2024 — McMap. All rights reserved.