Estimating/Choosing optimal Hyperparameters for DBSCAN
Asked Answered
M

2

11

I need to find naturally occurring classes of nouns based on their distribution with different preposition (like agentive, instrumental, time, place etc.). I tried using k-means clustering but of less help, it didn't work well, there was a lot of overlap over the classes that I was looking for (probably because of non-globular shape of classes and random initialisation in k-means).

I am now working on using DBSCAN, but I have trouble understanding the epsilon value and mini-points value in this clustering algorithm. Can I use random values or do I need to compute them. Can anybody help? Particularly with epsilon, at least how to compute it if I need to?

Mafia answered 24/2, 2013 at 9:29 Comment(0)
G
10

Use your domain knowledge to choose the parameters. Epsilon is a radius. You can think of it as a minimum cluster size.

Obviously random values won't work very well. As a heuristic, you can try to look at a k-distance plot; but it's not automatic either.

The first thing to do either way is to choose a good distance function for your data. And perform appropriate normalization.

As for "minPts" it again depends on your data and needs. One user may want a very different value than another. And of course minPts and Epsilon are coupled. If you double epsilon, you will roughly need to increase your minPts by 2^d (for Euclidean distance, because that is how the volume of a hypersphere increases!)

If you want lots of small and fine detailed clusters, choose a low minpts. If you want larger and fewer clusters (and more noise), use a larger minpts. If you don't want any clusters at all, choose minpts larger than your data set size...

Godiva answered 25/2, 2013 at 8:49 Comment(2)
I won't be able to tell you parameters here. You need to experiment. But seriously, first try to figure out how to measure similarity. A DBSCAN clustering result will always be only as good as your similarity function is.Godiva
I am assuming a hierarchical structure in my data, with 3 major classes. I have around 32K points with 15 dimensions. My data point:noun, count(prep1)/total count of a noun, count(prep2)/total ....... count(prep15)/total. I am using Euclidean distance function, I haven't tried others yet. What do you mean by normalisation, how I am supposed to normalise the data, I have already normalised the distributions by total frequency of a given noun. One more question, its about k-means, can I choose centroid before hand, as I can guess prototypes of each class given my domain knowledge.Mafia
E
6

It is highly important to select the hyperparameters of DBSCAN algorithm rightly for your dataset and the domain in which it belongs.


eps hyperparameter

In order to determine the best value of eps for your dataset, use the K-Nearest Neighbours approach as explained in these two papers: Sander et al. 1998 and Schubert et al. 2017 (both papers from the original DBSCAN authors).

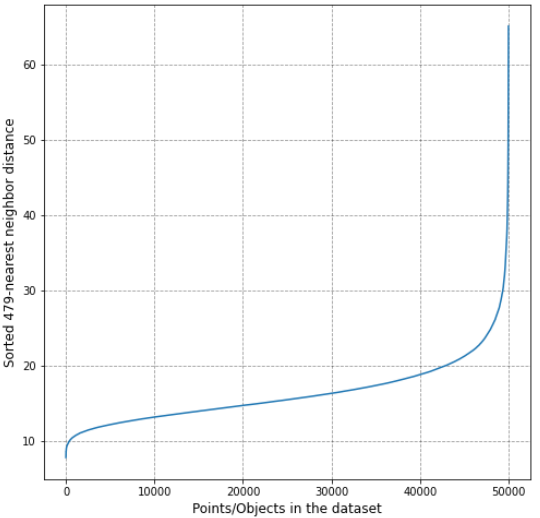
Here's a condensed version of their approach: If you have N-dimensional data to begin, then choose n_neighbors in sklearn.neighbors.NearestNeighbors to be equal to 2xN - 1, and find out distances of the K-nearest neighbors (K being 2xN - 1) for each point in your dataset. Sort these distances out and plot them to find the "elbow" which separates noisy points (with high K-nearest neighbor distance) from points (with relatively low K-nearest neighbor distance) which will most likely fall into a cluster. The distance at which this "elbow" occurs is your point of optimal eps.

Here's some python code to illustrate how to do this:

def get_kdist_plot(X=None, k=None, radius_nbrs=1.0):

    nbrs = NearestNeighbors(n_neighbors=k, radius=radius_nbrs).fit(X)

    # For each point, compute distances to its k-nearest neighbors
    distances, indices = nbrs.kneighbors(X) 
                                       
    distances = np.sort(distances, axis=0)
    distances = distances[:, k-1]

    # Plot the sorted K-nearest neighbor distance for each point in the dataset
    plt.figure(figsize=(8,8))
    plt.plot(distances)
    plt.xlabel('Points/Objects in the dataset', fontsize=12)
    plt.ylabel('Sorted {}-nearest neighbor distance'.format(k), fontsize=12)
    plt.grid(True, linestyle="--", color='black', alpha=0.4)
    plt.show()
    plt.close()


k = 2 * X.shape[-1] - 1 # k=2*{dim(dataset)} - 1
get_kdist_plot(X=X, k=k)

Here's an example resultant plot from the code above:

From the plot above, it can be inferred that the optimal value for eps can be assumed at around 22 for the given dataset.

NOTE: I would strongly advice the reader to refer to the two papers cited above (especially Schubert et al. 2017) for additional tips on how to avoid several common pitfalls when using DBSCAN as well as other clustering algorithms.

There are a few articles online –– DBSCAN Python Example: The Optimal Value For Epsilon (EPS) and CoronaVirus Pandemic and Google Mobility Trend EDA –– which basically use the same approach but fail to mention the crucial choice of the value of K or n_neighbors as 2xN-1 when performing the above procedure.


min_samples hyperparameter

As for the min_samples hyperparameter, I agree with the suggestions in the accepted answer. Also, a general guideline for choosing this hyperparameter's optimal value is that it should be set to twice the number of features (Sander et al. 1998). For instance, if each point in the dataset has 10 features, a starting point to consider for min_samples would be 20.

Expand answered 14/3, 2022 at 13:54 Comment(1)
It takes me a while to figure out what does the figure means. I would switch the X and Y axises to make it more understandable. Great explanation, anyway.Colic

© 2022 - 2024 — McMap. All rights reserved.