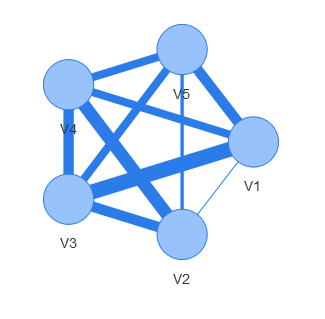
I have a very simple question regarding combining igraph with visNetwork. I want to weight the edges with visEdges(value=E(graph)$weight), but that does not work. Here is a toy example to illustrate the problem:
     test
     [,1] [,2] [,3] [,4] [,5]
[1,]    0    1    3    7    1
[2,]    4    0    8    9    5
[3,]   10    3    0    8    3
[4,]    5    1    5    0    7
[5,]    8    2    7    4    0

library(igraph); library(visNetwork)

test.gr <- graph_from_adjacency_matrix(test, mode="undirected", weighted=T)
If I now try to visualize it as a weighted graph, it doesn't plot it:
test.gr %>%
  visIgraph(layout = "layout_in_circle") %>%
  visEdges(value = E(test.gr)$weight)
If I use
test.gr %>%
  visIgraph(layout = "layout_in_circle") %>%
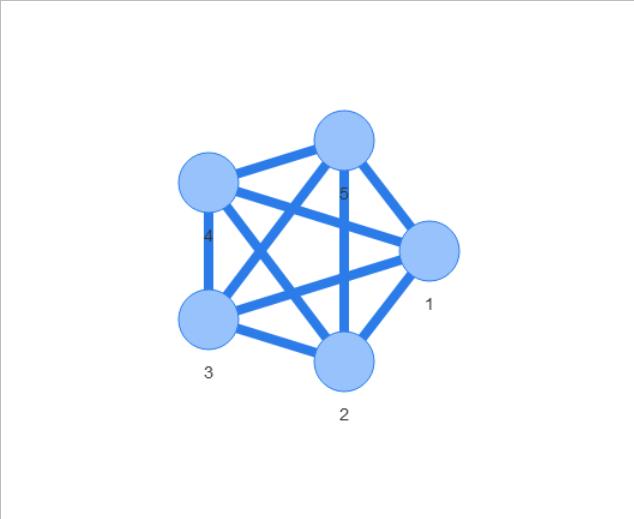
  visEdges(value = 10)
instead, I get a plot:
but this is of course not what I want. I want different edge widths according to E(test.gr)$weigth.
Can you tell me how I can do this?


