Consider this simple example
library(dplyr)
library(ggplot2)
library(tidyr)

mydata <- data_frame(group = c('a', 'a', 'a', 'b', 'b', 'b'),
                     x = c(1,2,3,5,6,7),
                     y = c(3,5,6,4,3,2))

mydata2 <- mydata %>% group_by(group) %>%
  nest() %>%
  mutate(myplot = map(data, ~ggplot(data = .x, aes(x = x, y = x)) + geom_point()))

pdf("P://mychart.pdf")
print(mydata2$myplot)
dev.off()
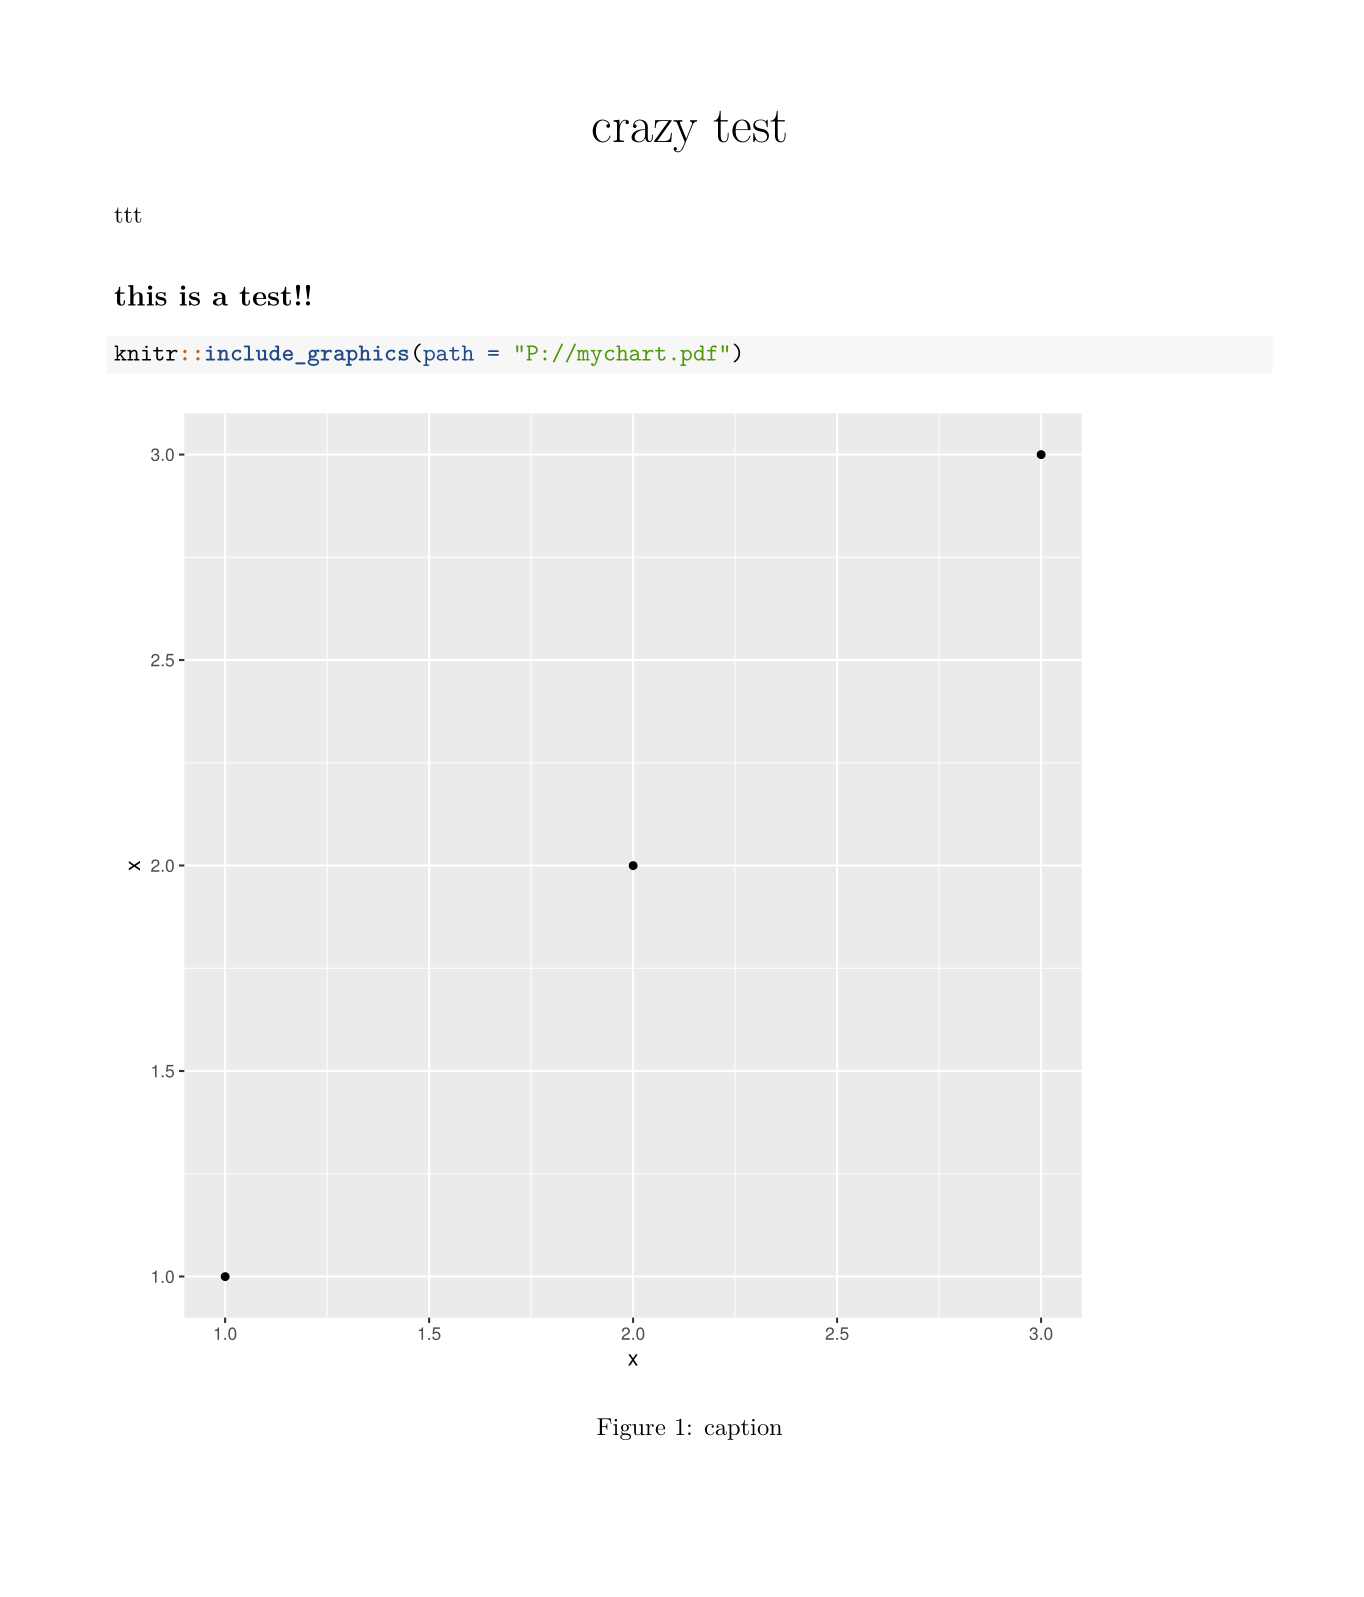
The code above will output a pdf with two pages. How can I show these two pages on my rmarkdown document?
Using
---
title: "crazy test"
output:
  pdf_document
---

```{r global_options, include=FALSE}
knitr::opts_chunk$set(echo = TRUE, fig.pos = 'h')
```


ttt

## this is a test!!

```{r label, out.width = "85%", fig.cap = "caption"}
knitr::include_graphics(path = "P://mychart.pdf")
```
will only show the first page of the pdf! Where is the other chart? :(
Any ideas?
Thanks!


pdffrom outside. you only have the pdf. how would you do it? – Kearneyinclude_graphicsfunction doesn't seem to support multipage pdfs as is. Try splitting your pdf with staplr (possibly in a chunk with echo=FALSE) and then including the resulting graphs in ainclude_graphicsloop. – Formulastaplr? sounds really promising!!! thanks – Kearneypdfpages, c.f. https://mcmap.net/q/1015671/-embed-a-pdf-in-a-r-markdown-file-and-adapt-pagination. – Hermosarmarkdown– Kearney