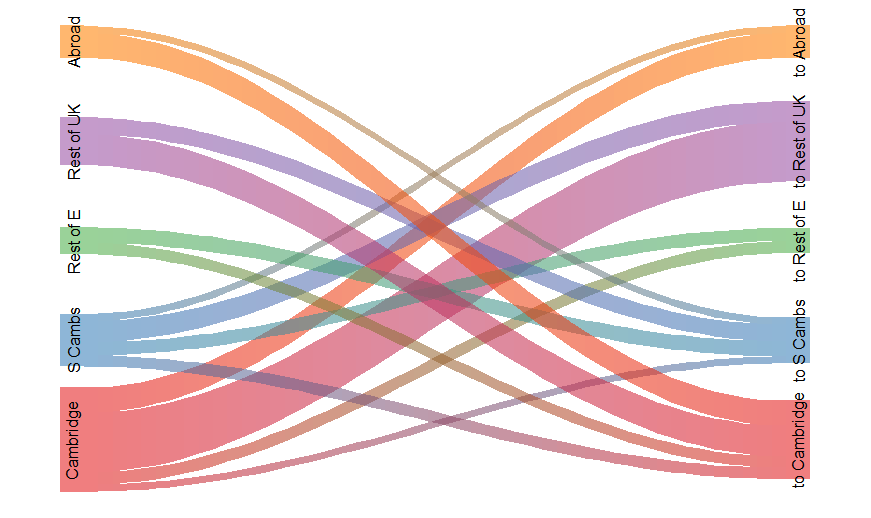
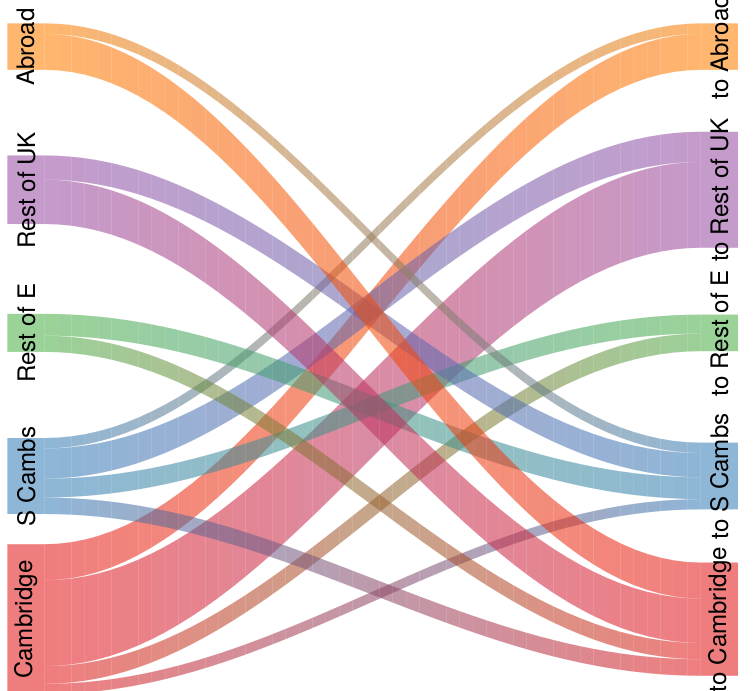
I've made a Sankey diagram in R Riverplot (v0.5), the output looks OK small in RStudio, but when exported or zoomed in it the colours have dark outlines or gridlines.

I think it may be because the outlines of the shapes are not matching the transparency I want to use for the fill?
I possibly need to find a way to get rid of outlines altogether (rather than make them semi-transparent), as I think they're also the reason why flows with a value of zero still show up as thin lines.
my code is here:
#loading packages
library(readr)
library("riverplot", lib.loc="C:/Program Files/R/R-3.3.2/library")
library(RColorBrewer)

#loaing data
Cambs_flows <- read_csv("~/RProjects/Cambs_flows4.csv")

#defining the edges
edges = rep(Cambs_flows, col.names = c("N1","N2","Value"))
edges    <- data.frame(edges)
edges$ID <- 1:25

#defining the nodes
nodes <- data.frame(ID = c("Cambridge","S Cambs","Rest of E","Rest of UK","Abroad","to Cambridge","to S Cambs","to Rest of E","to Rest of UK","to Abroad"))
nodes$x = c(1,1,1,1,1,2,2,2,2,2)
nodes$y = c(1,2,3,4,5,1,2,3,4,5)

#picking colours
palette = paste0(brewer.pal(5, "Set1"), "90")

#plot styles
styles = lapply(nodes$y, function(n) {
  list(col = palette[n], lty = 0, textcol = "black")
})

#matching nodes to names
names(styles) = nodes$ID

#defining the river
r <- makeRiver( nodes, edges,
                node_labels = c("Cambridge","S Cambs","Rest of E","Rest of UK","Abroad","to Cambridge","to S Cambs","to Rest of E","to Rest of UK","to Abroad"),
                node_styles = styles)

#Plotting
plot( r, plot_area = 0.9)
And my data is here
dput(Cambs_flows)
structure(list(N1 = c("Cambridge", "Cambridge", "Cambridge",
"Cambridge", "Cambridge", "S Cambs", "S Cambs", "S Cambs", "S Cambs",
"S Cambs", "Rest of E", "Rest of E", "Rest of E", "Rest of E",
"Rest of E", "Rest of UK", "Rest of UK", "Rest of UK", "Rest of UK",
"Rest of UK", "Abroad", "Abroad", "Abroad", "Abroad", "Abroad"
), N2 = c("to Cambridge", "to S Cambs", "to Rest of E", "to Rest of UK",
"to Abroad", "to Cambridge", "to S Cambs", "to Rest of E", "to Rest of UK",
"to Abroad", "to Cambridge", "to S Cambs", "to Rest of E", "to Rest of UK",
"to Abroad", "to Cambridge", "to S Cambs", "to Rest of E", "to Rest of UK",
"to Abroad", "to Cambridge", "to S Cambs", "to Rest of E", "to Rest of UK",
"to Abroad"), Value = c(0L, 1616L, 2779L, 13500L, 5670L, 2593L,
0L, 2975L, 4742L, 1641L, 2555L, 3433L, 0L, 0L, 0L, 6981L, 3802L,
0L, 0L, 0L, 5670L, 1641L, 0L, 0L, 0L)), class = c("tbl_df", "tbl",
"data.frame"), row.names = c(NA, -25L), .Names = c("N1", "N2",
"Value"), spec = structure(list(cols = structure(list(N1 = structure(list(), class = c("collector_character",
"collector")), N2 = structure(list(), class = c("collector_character",
"collector")), Value = structure(list(), class = c("collector_integer",
"collector"))), .Names = c("N1", "N2", "Value")), default = structure(list(), class = c("collector_guess",
"collector"))), .Names = c("cols", "default"), class = "col_spec"))


