Color gradients in R in PDF and bitmap output
Asked Answered
G

2

6

I am struggling to get a visually acceptable color gradient in R (see here for a detailed description of my particular case). The problem, in short, is that while output in the R window looks OK, PDFs show thin, white lines between segments used to generate the gradient.

n <- 100
cc <- colorRampPalette(c("red", "blue"))(n)
plot.new()
par(mar=rep(0,4))
sapply(1:n, function(i) rect((i-1)/n, 0, i/n, 1, col=cc[i], border=NA))
dev.copy2pdf(file="test.pdf")

Here is the result:

screenshot 1

You can see the thin, white lines. Their positioning depends on the zoom, so I assume that they are an artifact of how the PDF is displayed. Here the same in another zoom:

screenshot 2

Unfortunately, these lines are also visible on a printout. I guess the problem may be with how the coordinates in the PDF get rounded when the vector graphics is rendered to bitmap for display or printing.

A possible solution would be to use segments which overlap with each other. This is acceptable only for solid colors; unfortunately, I would like to use transparent colors in the gradients as well.

What can I do to make my output in PDF better?

Gib answered 22/2, 2017 at 9:8 Comment(3)
could you set the border colour to the sane as the segment border=cc[i]Mccormac
nope, same problem with transparency. Actually, I tried to solve it like this previously. Here is why this didn't work: #41089251Gib
I ran your code but I don't see the white lines. Neither in x11 device nor in the output pdf (Foxit pdf) ! try it with other pdf applicationsMima
W
2

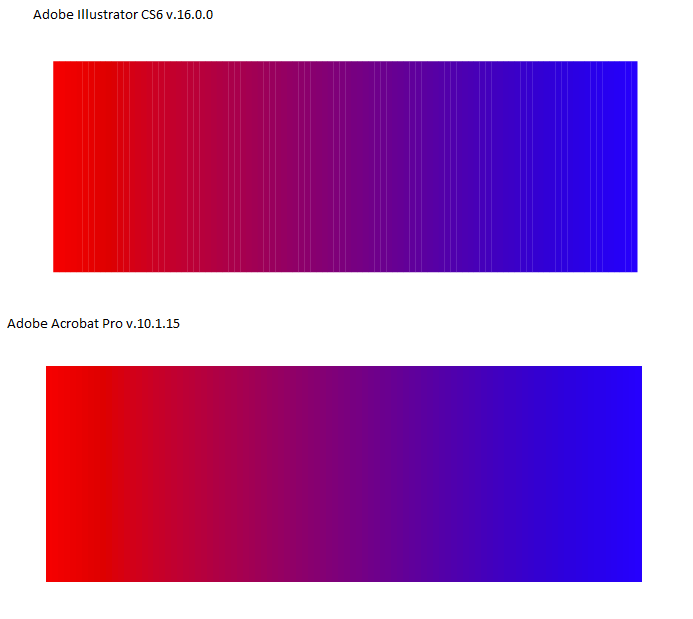
This seems to be an issue purely due to the renderer. E.g.:

enter image description here

I don't believe there's anything you can change about the PDF to fundamentally fix the issue. In my case, Adobe Acrobat looked good at any zoom level except at very high zoom (I had to go to 3200% zoom to see white lines).

Also, Chrome and Microsoft Edge seemed to work well.

Weevil answered 24/2, 2017 at 21:19 Comment(1)
Thanks! that was helpful.Gib
E
0

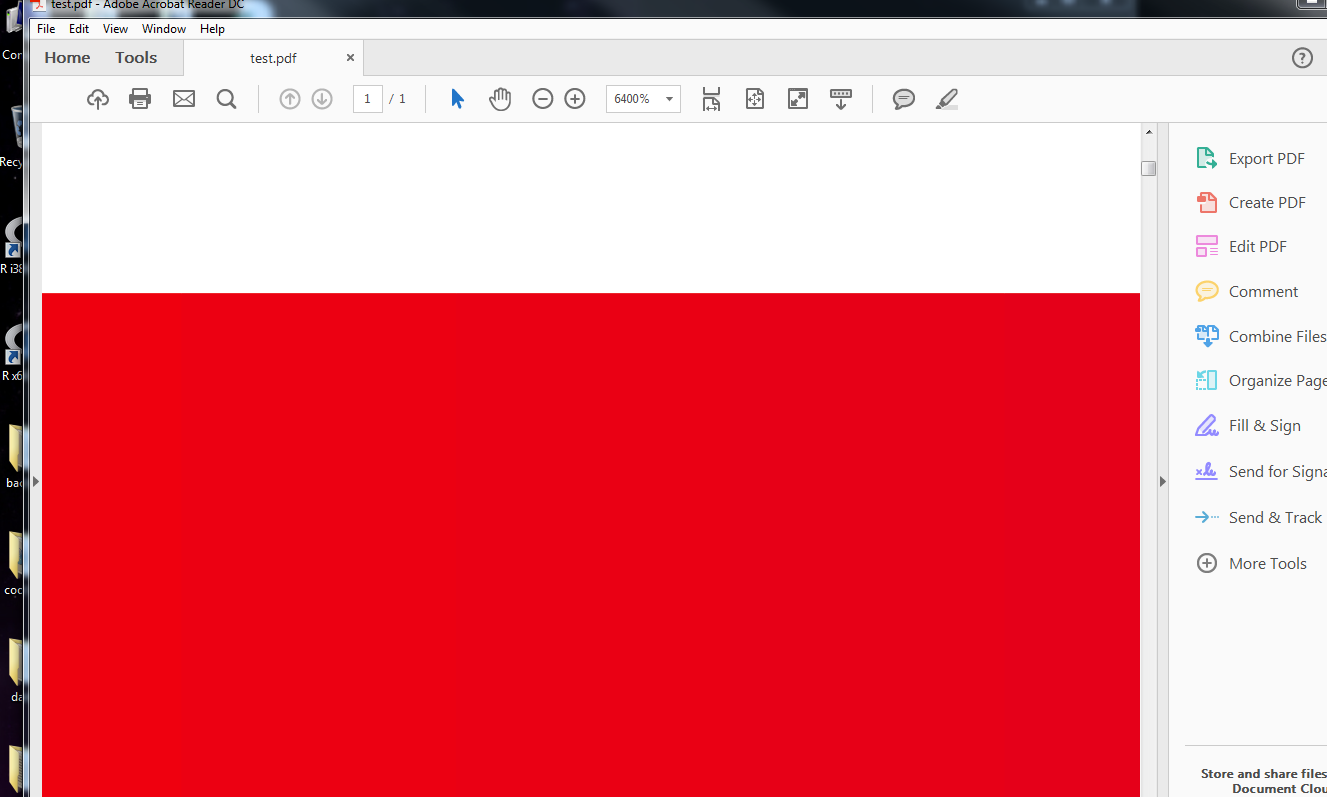
Have you tried this solution? The first rectangle will take a bigger space and the second will be plotted on the first one thus eliminating the white lines behind it. The pdf that Ive got does not show white lines

n <- 100
cc <- colorRampPalette(c("red", "blue"))(n)
plot.new()
par(mar=rep(0,4))
sapply(1:n, function(i) rect((i-1)/n, 0, (i + 1)/n, 1, col=cc[i], border=NA))
dev.copy2pdf(file="test.pdf")

enter image description here This is zoomed in at 6400 percent

Epistyle answered 24/2, 2017 at 14:55 Comment(1)
Yes, read the paragraph starting with "A possible" in my original post. The problem is that then you get dark stripes if you use transparent colors.Gib

© 2022 - 2024 — McMap. All rights reserved.