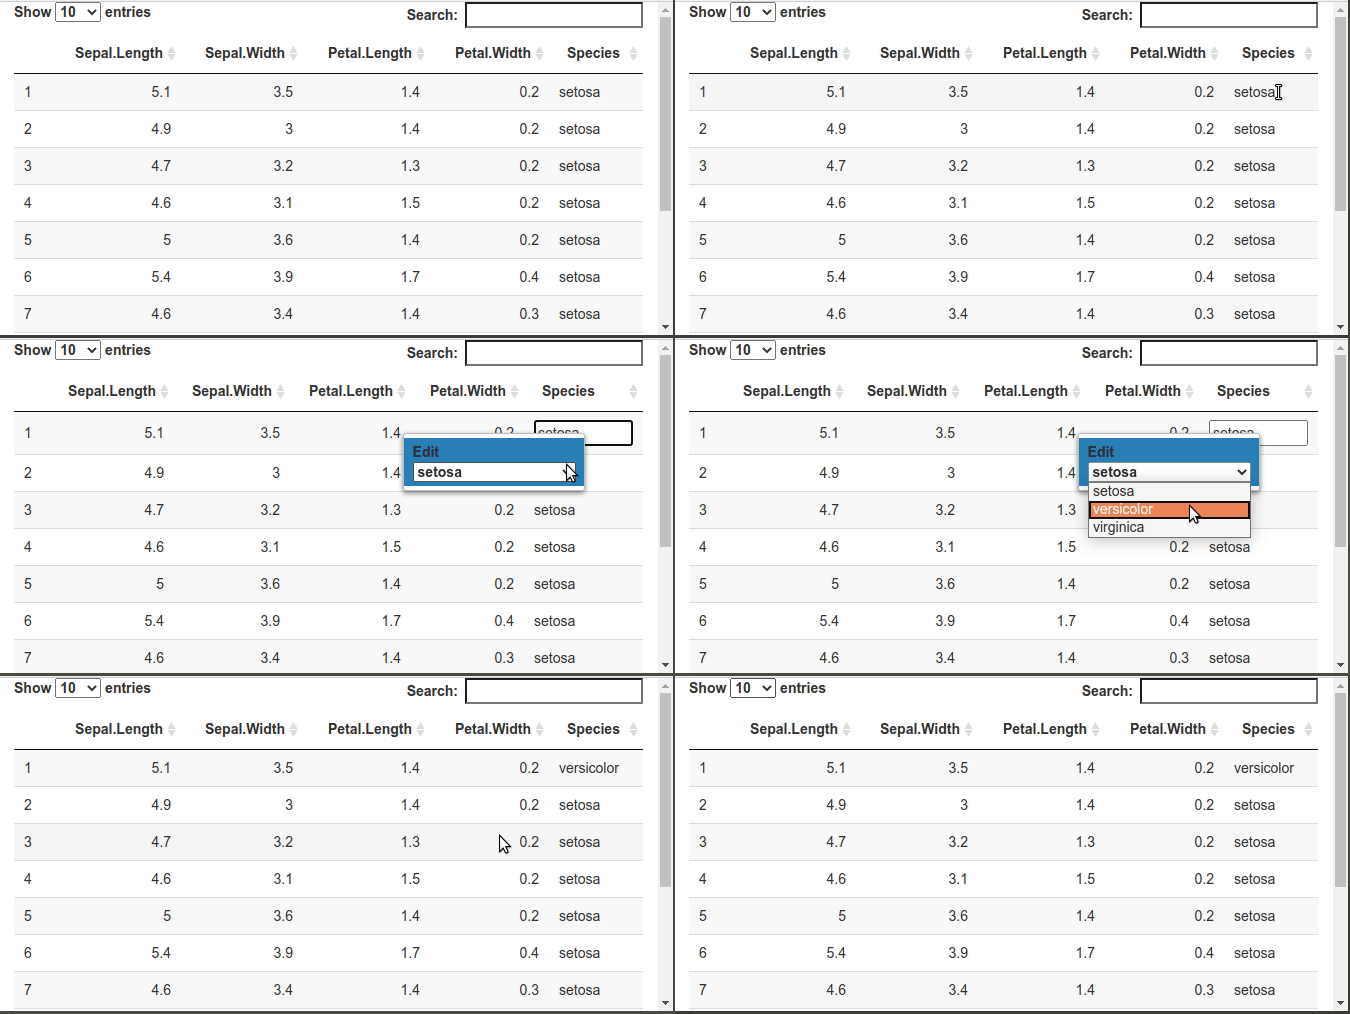
As I said in a comment, you can do that with the JS library cellEdit.
Here is another way, using the JS library contextMenu (a jQuery plugin).
library(shiny)
library(DT)

callback <- c(
  "var id = $(table.table().node()).closest('.datatables').attr('id');",
  "$.contextMenu({",
  "  selector: '#' + id + ' td.factor input[type=text]',",
  "  trigger: 'hover',",
  "  build: function($trigger, e){",
  "    var colindex = table.cell($trigger.parent()[0]).index().column;",
  "    var coldata = table.column(colindex).data().unique();",
  "    var options = coldata.reduce(function(result, item, index, array){",
  "      result[index] = item;",
  "      return result;",
  "    }, {});",
  "    return {",
  "      autoHide: true,",
  "      items: {",
  "        dropdown: {",
  "          name: 'Edit',",
  "          type: 'select',",
  "          options: options,",
  "          selected: 0",
  "        }",
  "      },",
  "      events: {",
  "        show: function(opts){",
  "          opts.$trigger.off('blur');",
  "        },",
  "        hide: function(opts){",
  "          var $this = this;",
  "          var data = $.contextMenu.getInputValues(opts, $this.data());",
  "          var $input = opts.$trigger;",
  "          $input.val(options[data.dropdown]);",
  "          $input.trigger('change');",
  "        }",
  "      }",
  "    };",
  "  }",
  "});"
)
ui <- fluidPage(
  tags$head(
    tags$link(
      rel = "stylesheet",
      href = "https://cdnjs.cloudflare.com/ajax/libs/jquery-contextmenu/2.8.0/jquery.contextMenu.min.css"
    ),
    tags$script(
      src = "https://cdnjs.cloudflare.com/ajax/libs/jquery-contextmenu/2.8.0/jquery.contextMenu.min.js"
    )
  ),
  DTOutput("dtable")
)

server <- function(input, output){
  output[["dtable"]] <- renderDT({
    datatable(
      iris, editable = "cell", callback = JS(callback),
      options = list(
        columnDefs = list(
          list(
            targets = 5, className = "factor"
          )
        )
      )
    )
  }, server = FALSE)
}

shinyApp(ui, server)
![enter image description here]()
EDIT
Here is an improvement. In the previous app, the dropdown options are set to the unique values of the column. With the app below, you can set the dropdown options you want.
library(shiny)
library(DT)

callback <- c(
  "var id = $(table.table().node()).closest('.datatables').attr('id');",
  "$.contextMenu({",
  "  selector: '#' + id + ' td.factor input[type=text]',",
  "  trigger: 'hover',",
  "  build: function($trigger, e){",
  "    var levels = $trigger.parent().data('levels');",
  "    if(levels === undefined){",
  "      var colindex = table.cell($trigger.parent()[0]).index().column;",
  "      levels = table.column(colindex).data().unique();",
  "    }",
  "    var options = levels.reduce(function(result, item, index, array){",
  "      result[index] = item;",
  "      return result;",
  "    }, {});",
  "    return {",
  "      autoHide: true,",
  "      items: {",
  "        dropdown: {",
  "          name: 'Edit',",
  "          type: 'select',",
  "          options: options,",
  "          selected: 0",
  "        }",
  "      },",
  "      events: {",
  "        show: function(opts){",
  "          opts.$trigger.off('blur');",
  "        },",
  "        hide: function(opts){",
  "          var $this = this;",
  "          var data = $.contextMenu.getInputValues(opts, $this.data());",
  "          var $input = opts.$trigger;",
  "          $input.val(options[data.dropdown]);",
  "          $input.trigger('change');",
  "        }",
  "      }",
  "    };",
  "  }",
  "});"
)

createdCell <- function(levels){
  if(missing(levels)){
    return("function(td, cellData, rowData, rowIndex, colIndex){}")
  }
  quotedLevels <- toString(sprintf("\"%s\"", levels))
  c(
    "function(td, cellData, rowData, rowIndex, colIndex){",
    sprintf("  $(td).attr('data-levels', '[%s]');", quotedLevels),
    "}"
  )
}

ui <- fluidPage(
  tags$head(
    tags$link(
      rel = "stylesheet",
      href = "https://cdnjs.cloudflare.com/ajax/libs/jquery-contextmenu/2.8.0/jquery.contextMenu.min.css"
    ),
    tags$script(
      src = "https://cdnjs.cloudflare.com/ajax/libs/jquery-contextmenu/2.8.0/jquery.contextMenu.min.js"
    )
  ),
  DTOutput("dtable")
)

server <- function(input, output){
  output[["dtable"]] <- renderDT({
    datatable(
      iris, editable = "cell", callback = JS(callback),
      options = list(
        columnDefs = list(
          list(
            targets = 5,
            className = "factor",
            createdCell = JS(createdCell(c(levels(iris$Species), "another level")))
          )
        )
      )
    )
  }, server = FALSE)
}

shinyApp(ui, server)
If you want to use the unique values of the column, set the option createdCell to JS(createdCell()), or simply don't set this option.

