From a Pandas Dataframe, build networkx chart or flow chart between different rows with common values in certain columns
Asked Answered
M

1

2

I'm working with data that shows order flow across multiple rows, with each row being an independent stop/station. Sample data looks like this:

  Firm           event_type   id previous_id
0    A                 send  111            
1    B     receive and send  222         111
2    C  receive and execute  333         222
3    D  receive and execute  444         222
4    E   receive and cancel  123         100

The link here is decided by the two fields "id" and "previous_id". For instance, in the sample data, the previous_id of Firm B is the same as the id of Firm A, 111. Therefore order flows from Firm A to Firm B.

And for Firm E, since its previous_id doesn't match the id of any row, I intend it to be a standalone part in the flow.

Therefore what I want to achieve based on the sample data is something like this: Flow
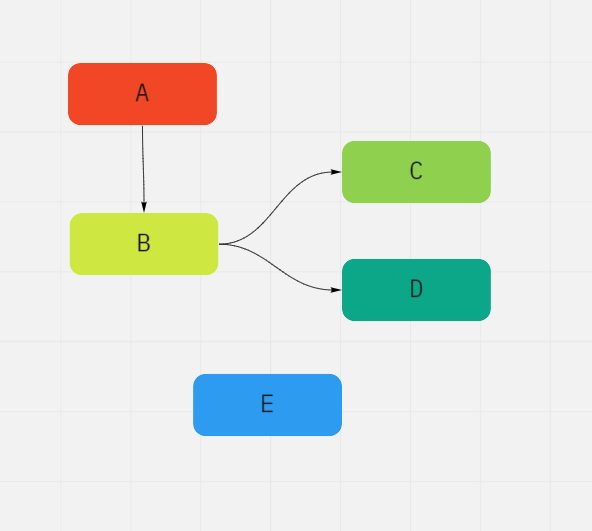
(Color is just for illustration purposes, not a must have).

I have been trying to work upon answer from @Dinari in this related question but couldn't get it to work. I would like the label of the networkx directed chart to be a column other than the columns with shared values.

Thanks.

Monostylous answered 28/4, 2021 at 22:45 Comment(0)
P
1
# convert dataypes to ensure that dictionary access will work
df['id'] = df['id'].astype(str)
df['previous_id'] = df['previous_id'].astype(str)

# create a mapping from ids to Firms
replace_dict = dict(df[['id', 'Firm']].values)

# apply that mapping. If no Firm can be found use placeholders 'no_source' and 'no_target'
df['source'] = df['previous_id'].apply(lambda x: replace_dict.get(x) if replace_dict.get(x) else 'no_source' )
df['target'] = df['id'].apply(lambda x: replace_dict.get(x) if replace_dict.get(x) else 'no_target' )

#make the graph
G = nx.from_pandas_edgelist(df, source='source', target='target')

# drop all placeholder nodes
G.remove_nodes_from(['no_source', 'no_target'])

# draw graph
nx.draw_networkx(G, node_shape='s')

Edit: to include arrows, create a directed graph (DiGraph):

#make the graph
G = nx.from_pandas_edgelist(df, source='source', target='target', create_using=nx.DiGraph)
Phenice answered 1/5, 2021 at 7:15 Comment(1)
Thanks a lot for your answer. Just one more thing: the draw_networkx function doesn't show direction between nodes, which is quite important for my case. Is there anyway to modify your code to achieve that? Thanks.Monostylous

© 2022 - 2024 — McMap. All rights reserved.