Build networkx directed graph or flow chart from more than one column of pandas dataframe
Asked Answered
A

1

5

I have pandas dataframe which consist of 10 columns.

  • each row consist a step performed by a user to online. there are total of 10 columns so all 10 step process
  • lets say first activity is booking a flight ticket so steps are login website-->give src dest time-->select seats-->pay--review

enter image description here

so there are various permutations can happen at every step, I want to draw a directed graph out of all dataset.

currently networkx supports only 2 columns in

# libraries
import pandas as pd
import numpy as np
import networkx as nx
import matplotlib.pyplot as plt

# Build your graph
G=nx.from_pandas_dataframe(df, 'src', 'dest',create_using=nx.DiGraph())

# Plot it
nx.draw(G, with_labels=True)
plt.show()

can someone tell me how to d it for more than two column directed graph

Alys answered 20/11, 2018 at 9:8 Comment(0)
R
4

networkx from_pandas_dataframe uses add_edges_from, you can do a similar thing:

# libraries
import pandas as pd
import numpy as np
import networkx as nx
import matplotlib.pyplot as plt

# Build your graph

df = pd.DataFrame(np.random.randn(2,4),columns=list('ABCD')) #Create a 4 column data frame

columns = list(df.columns.values)# Get columns name

g = nx.empty_graph(0, nx.DiGraph()) #initialize an empty graph

for i in range(len(columns)-1):
    g.add_edges_from(zip(df[columns[i]], df[columns[i+1]])) #Create edge between 2 values, between all consecutive coumns

# Plot it
nx.draw(g, with_labels=True)
plt.show()

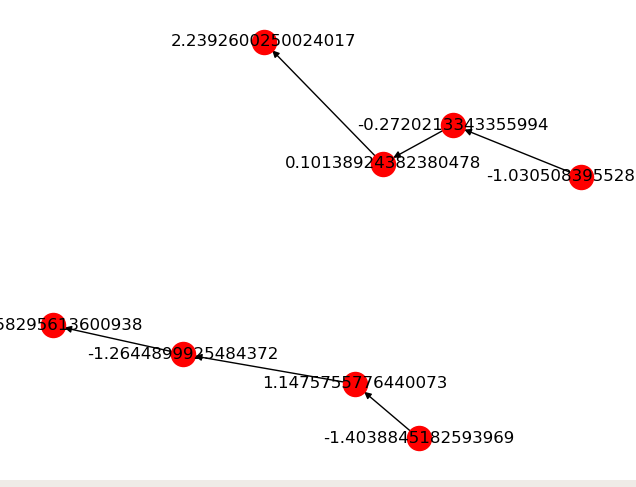
With a result:

Resulting graph

Rosinweed answered 20/11, 2018 at 9:36 Comment(1)
Amazing answer! Is there anyway to connect different rows in a similar fashion? For instance, if value in one column of one row matches the value of the same (or another) column in another row, then link the two rows together, using a certain column as label? Thanks.Pinnatifid

© 2022 - 2024 — McMap. All rights reserved.