How can I get the console logs from the iOS Simulator?
Asked Answered
U

16

311

I want to see what happens in the iOS Simulator if I'm not testing the app in Xcode.

For example, if I open a link in the Safari simulator, see what happens in the console, or if I install a web-app, see the links that I'm pressing in console.

How can I do this?

I want to see it in Xcode or Terminal, but it's not a problem if I need to use another bit of software.

Unfledged answered 15/4, 2012 at 20:9 Comment(1)
U
317

iOS Simulator > Menu Bar > Debug > Open System Log


Old ways:

iOS Simulator prints its logs directly to stdout, so you can see the logs mixed up with system logs.

Open the Terminal and type: tail -f /var/log/system.log

Then run the simulator.

EDIT:

This stopped working on Mavericks/Xcode 5. Now you can access the simulator logs in its own folder: ~/Library/Logs/iOS Simulator/<sim-version>/system.log

You can either use the Console.app to see this, or just do a tail (iOS 7.0.3 64 bits for example):

tail -f ~/Library/Logs/iOS\ Simulator/7.0.3-64/system.log

EDIT 2:

They are now located in ~/Library/Logs/CoreSimulator/<simulator-hash>/system.log

tail -f ~/Library/Logs/CoreSimulator/<simulator-hash>/system.log

Unijugate answered 15/4, 2012 at 20:12 Comment(9)
Is this still accurate? I'm not seeing anything from console.log in these log using tail or Console.appIphagenia
I am not getting any results either on OSX 10.10. those logs are there but my simulator is version 8.1 and the logs all are versions 7.1*Disparate
iOS Simulator > Menu Bar > Debug > Open System LogCrippling
Thanks! Its ~/Library/Logs/CoreSimulator/<simulator-hash>/system.log these days though.Halcyon
The answer from BYossarian is the "correct" one. "Develop menu in desktop safari that lets you see the iOS simulator console: Develop -> iPhone Simulator -> site name"Bubal
In case you're unsure of what <simulator-hash> to use (I was), you can also simply do: tail -f ~/Library/Logs/CoreSimulator/*/system.log which would render all but keep on tailing only the one that gets updated (most likely the running one)Astrogation
If you use fastlane, I added support for this in the 'scan' action in the Fastlane toolset: github.com/fastlane/fastlane/releases/tag/2.9.0Orgiastic
Sorry, this log is almost empty for me, it should be polluted with many system messages similar to logcat on Android.Sextet
Only the other answer worked for me https://mcmap.net/q/74436/-how-can-i-get-the-console-logs-from-the-ios-simulatorStaciestack
T
266

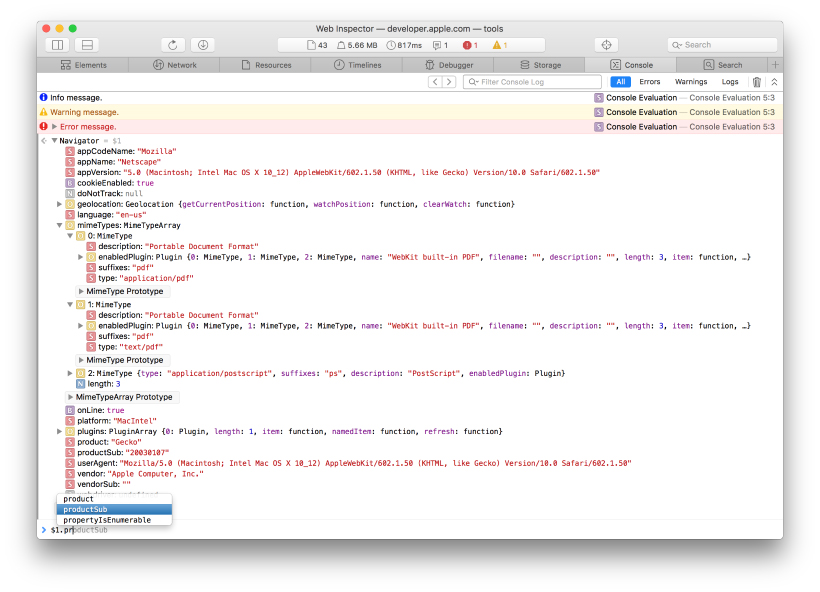
You can view the console for the iOS Simulator via desktop Safari. It's similar to the way you use desktop Safari to view the console for physical iOS devices.

Whenever the simulator is running and there's a webpage open, there'll be an option under the Develop menu in desktop safari that lets you see the iOS simulator console:

Develop -> iPhone Simulator -> site name

Thunell answered 19/1, 2013 at 15:14 Comment(4)
Note that you need a device or the Simulator running iOS >= 6. You also may have to enable Web Inspector support on iOS (Settings App > Safari > Advanced).Kwangtung
Looks like is now just: Develop > Simulator > (your simulator name)Amoral
I had to first open the Simulator, and then restart Safari in order to get the option this answer describes. But then it worked like a charm.Hooded
This is the only one that worked for me. Also you have first to enable that Develop menu going to: Preferences > Advanced > [Check] Show Develop menu in menu bar.Decrescendo
S
120

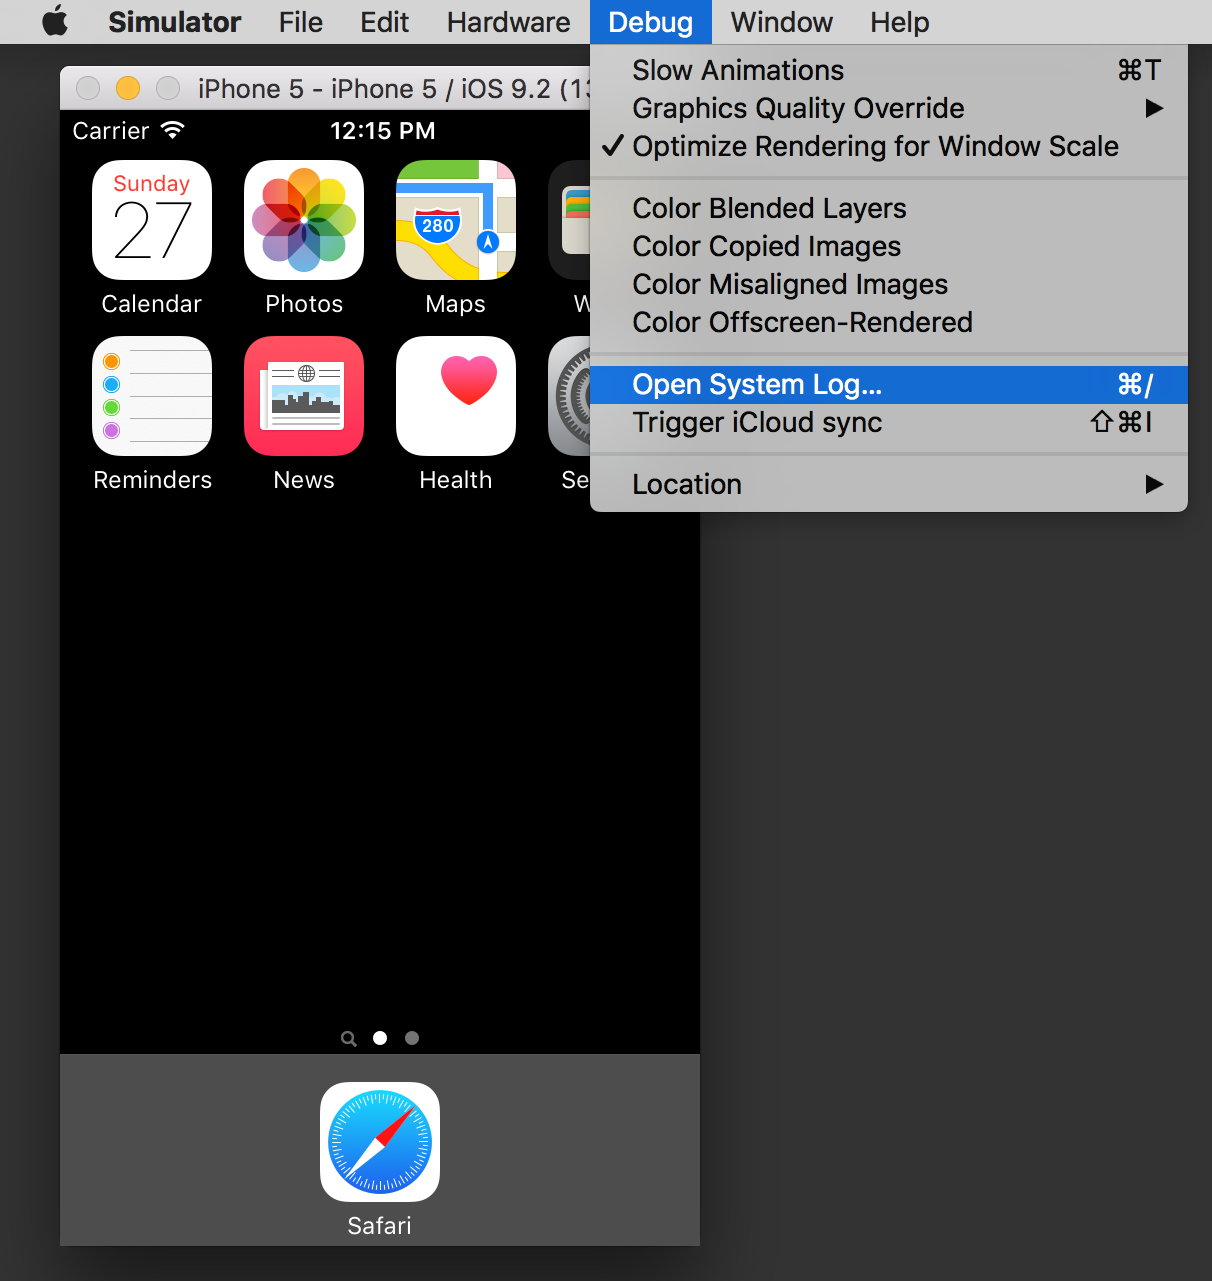
There's an option in the Simulator to open the console

Debug > Open System Log

or use the

keyboard shortcut: ⌘/

Simulator menu screenshot

Siward answered 22/7, 2014 at 15:58 Comment(0)
E
95

iOS 8 and iOS 9

Under iOS 8 and iOS 9 this location is now:

~/Library/Logs/CoreSimulator/<DEVICE_CODE>

So, the following will work:

tail -f ~/Library/Logs/CoreSimulator/<DEVICE_CODE>/system.log

The DEVICE_CODE value can be found via the following terminal command:

instruments -s devices
Expensive answered 13/9, 2014 at 11:55 Comment(5)
To find the device identifier: in Xcode, click Windows > Devices. A device and the identifier will be displayed in the right-hand pane.Loux
You can type instruments -s devices in the consoleExpensive
s/console/terminal window/Fervid
This didn't work for me. xcrun simctl spawn booted log stream --level=debug | grep App_Debug_String worked.Illinois
@Expensive instruments command not found. Where is instruments located?Sextet
M
47

You should not rely on instruments -s. The officially supported tool for working with Simulators from the command line is xcrun simctl.

The log directory for a device can be found with xcrun simctl getenv booted SIMULATOR_LOG_ROOT. This will always be correct even if the location changes.

Now that things are moving to os_log it is easier to open Console.app on the host Mac. Booted simulators should show up as a log source on the left, just like physical devices. You can also run log commands in the booted simulator:

# os_log equivalent of tail -f
xcrun simctl spawn booted log stream --level=debug

# filter log output
xcrun simctl spawn booted log stream --predicate 'processImagePath endswith "myapp"'
xcrun simctl spawn booted log stream --predicate 'eventMessage contains "error" and messageType == info'

# a log dump that Console.app can open
xcrun simctl spawn booted log collect

# open location where log collect will write the dump
cd `xcrun simctl getenv booted SIMULATOR_SHARED_RESOURCES_DIRECTORY`

If you want to use Safari Developer tools (including the JS console) with a webpage in the Simulator: Start one of the simulators, open Safari, then go to Safari on your mac and you should see Simulator in the menu.

You can open a URL in the Simulator by dragging it from the Safari address bar and dropping on the Simulator window. You can also use xcrun simctl openurl booted <url>.

Misfeasor answered 27/1, 2017 at 5:28 Comment(9)
This is the correct answer now as of Xcode 9.3, iOS 11. The locations mentioned in other answers is no longer correct.Litmus
This worked for me on Xcode Version 10.1 (10B61), iOS 12.1 Simulator. Using it to view iOS app console output in Emacs. Other answers worked in the past, but no longer.Gooding
For me, the thing that worked was the order (I had Safari open before the Simulator and so the menu entry did not appear in Safari)!Drenthe
Where did you find the documentation for the "predicate" flag?Volcanology
New to macOS 11 and iOS 14 simulators: log help predicates will give you more information. The predicate format follows NSPredicate.Misfeasor
This is the best answer by a long way, if you can't use idevicesyslog with a simulator.Illinois
xcrun simctl spawn booted log stream --level=debug works for me! The other answers such as system.log does not show logs of my appConvolution
I've started using Logger in Swift to log info messages. I don't see them in Console.app. What I do see is some system events for the simulator I'm running when I launch the app. How do I see these Logger info messages? Is there a document that explains how to do this?Groh
Not sure when this may have changed, but using Xcode 14.3.1 and a simulator running iOS 17, the xcrun simctl spawn booted log collect outputted: Archive successfully written to /Users/<user>/Library/Logs/CoreSimulator/<simulator_guid>/system_logs.logarchive which allowed me to open the results. The output from xcrun simctl getenv booted SIMULATOR_SHARED_RESOURCES_DIRECTORY was /Users/<user>/Library/Developer/CoreSimulator/Devices/<simulator_guid>/data. Spent a few minutes confused because I couldn't find the log file as I was in the wrong directory.Litmus
E
26

Apple logs

[iOS Logger]

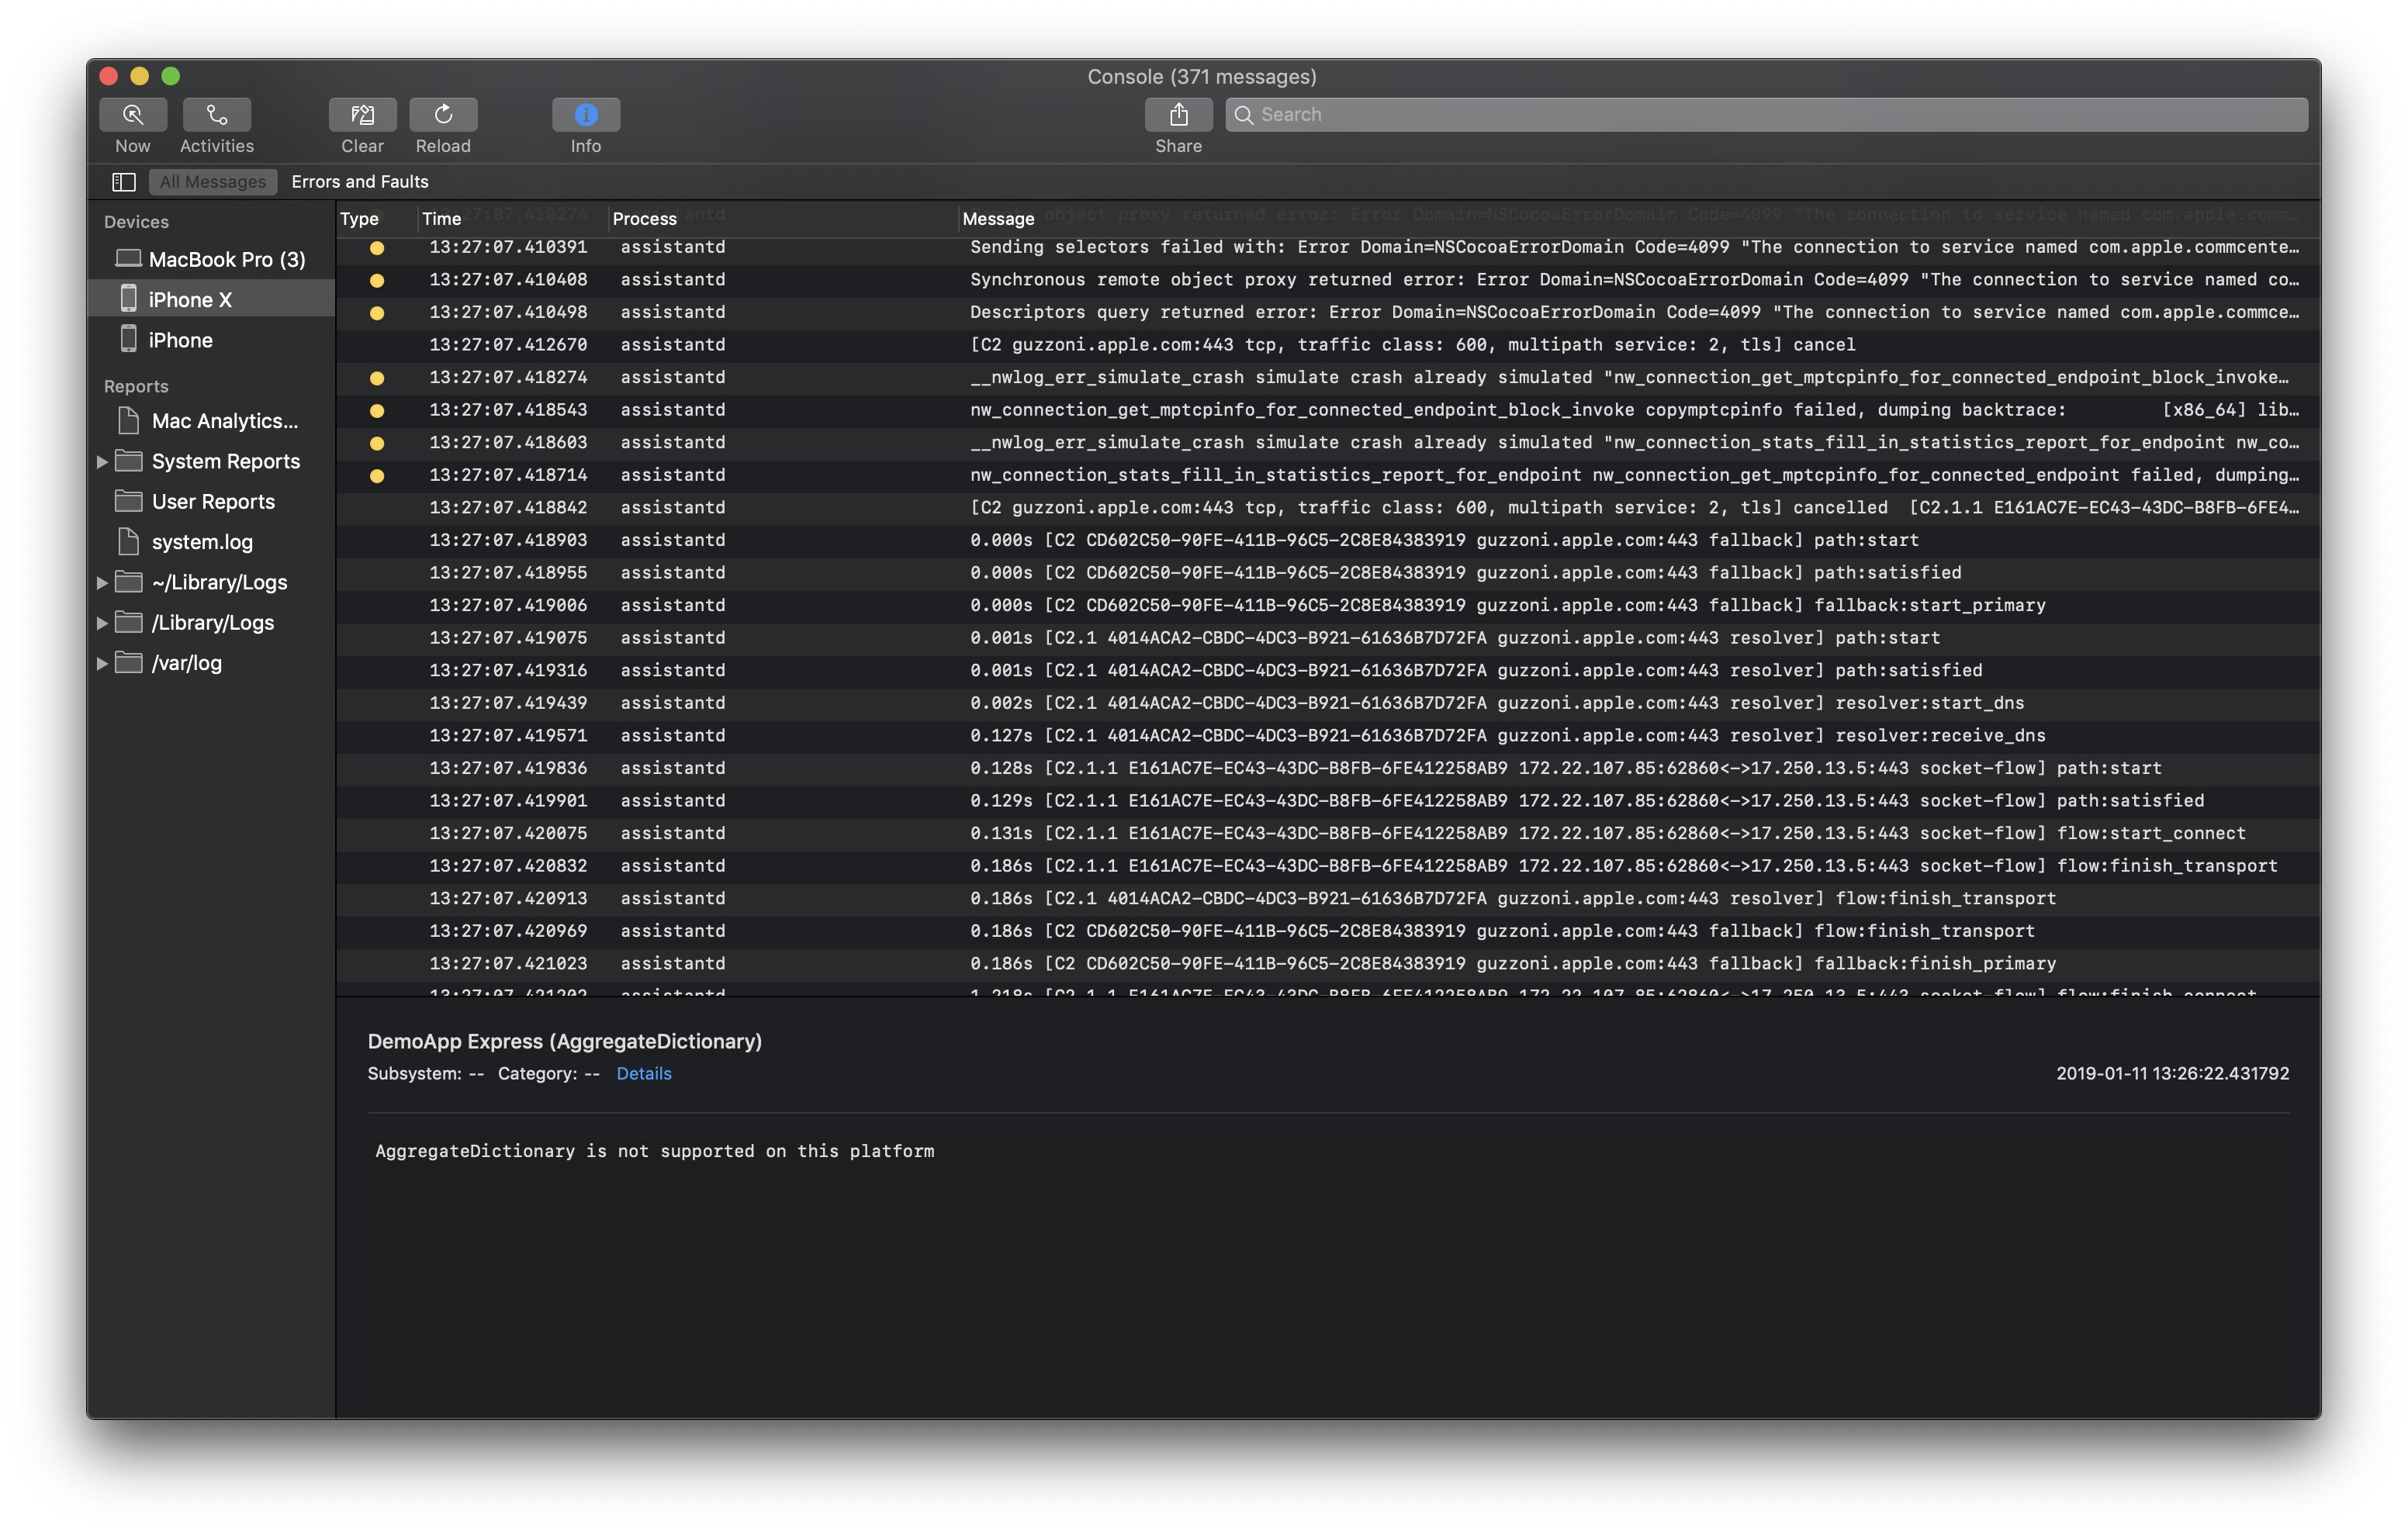
You can use the Console application(select your device in Devices) on your Mac to see a log message that were sent using NSLog, os_log, Logger (you will not see logs from print function).

Also please check (Action -> Include <Info/Debug> Messages)

enter image description here

Please note that if you want to see a log from WebView(UIWebView or WKWebView) you should use Safari Web Inspector

Device
- Settings -> Safari -> Advanced -> <check in> Web Inspector
Mac
- Safari -> Settings -> Advanced -> <check in> Show Develop menu in menu bar
- Develop -> <device>

[Find crash log]

Eyeleen answered 11/1, 2019 at 11:30 Comment(2)
press cmd then space bar Type "Console" press enter. Btw. that should be the correct answer today.Fingerboard
This is the only true solution to get all logs of your simulator compared to logcat on Android.Sextet
I
21

If you are using Swift, remember that println will only print to the debug log (which appears in xCode's debug area). If you want to print to system.log, you have to use NSLog as in the old days.

Then you can view the simulator log via its menu, Debug > Open System Log... (cmd + /)

Inlet answered 20/1, 2015 at 12:48 Comment(0)
N
12

tailing /var/log/system.log didn't work for me. I found my logs by using Console.app. They were in

~/Library/Logs/iOS Simulator/{version}/system.log

Newfashioned answered 26/7, 2013 at 19:2 Comment(1)
This is a great method to look back at logs from, e.g. days ago.Gravois
T
7

XCode > 6.0 AND iOS > 8.0 The below script works if you have XCode version > 8.0

I use the below small Script to tail the simulator logs onto the system console.

#!/bin/sh
sim_dir=`xcrun instruments -s | grep "iPhone 6 (8.2 Simulator)" | awk {'print $NF'} | tr -d '[]'`
tail -f ~/Library/Logs/CoreSimulator/$sim_dir/system.log

You can pass in the simulator type used in the Grep as an argument. As mentioned in the above posts, there are simctl and instruments command to view the type of simulators available for use depending on the Xcode version. To View the list of available devices/simulators.

xcrun instruments -s

OR

xcrun simctl list

Now you can pass in the Device code OR Simulator type as an argument to the script and replace the "iPhone 6 (8.2 Simulator)" inside grep to be $1

Teazel answered 27/2, 2015 at 23:34 Comment(0)
F
3

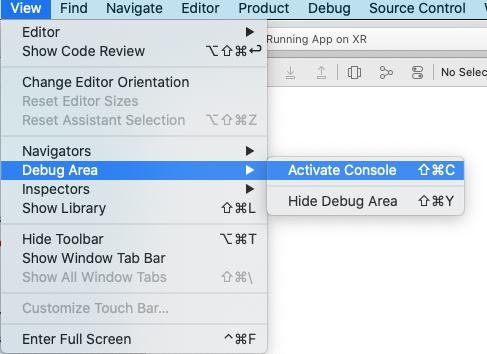
In Xcode: View->Debug Area->Activate Console

enter image description here

Five answered 2/12, 2020 at 0:13 Comment(0)
G
1

You can see the Simulator console window, including Safari Web Inspector and all the Web Development Tools by using the Safari Technology Preview app. Open your page in Safari on the Simulator and then go to Safari Technology Preview > Develop > Simulator.

Web Development Tools

Glorify answered 28/2, 2020 at 6:17 Comment(2)
where is Safari Technology Preview ?Staciestack
@Staciestack developer.apple.com/safari/resourcesRedeploy
H
0

I can open the log directly via the iOS simulator: Debug -> Open System Log... Not sure when this was introduced, so it might not be available for earlier versions.

Hercule answered 7/12, 2015 at 17:27 Comment(0)
N
0

No NSLog or print content will write to system.log, which can be open by Select Simulator -> Debug -> Open System log on Xcode 11.

I figure out a way, write logs into a file and open the xx.log with Terminal.app.Then the logs will present in Terminal.app lively.

I use CocoaLumberjack achieve this.

STEP 1:

Add DDFileLogger DDOSLogger and print logs path. config() should be called when App lunch.

static func config() {
    #if DEBUG
    DDLog.add(DDOSLogger.sharedInstance) // Uses os_log
    let fileLogger: DDFileLogger = DDFileLogger() // File Logger
    fileLogger.rollingFrequency = 60 * 60 * 24 // 24 hours
    fileLogger.logFileManager.maximumNumberOfLogFiles = 7
    DDLog.add(fileLogger)
    DDLogInfo("DEBUG LOG PATH: " + (fileLogger.currentLogFileInfo?.filePath ?? ""))
    #endif
}

STEP 2:

Replace print or NSLog with DDLogXXX.

STEP 3:

$ tail -f {path of log}

Here, message will present in Terminal.app lively.

One thing more. If there is no any message log out, make sure Environment Variables -> OS_ACTIVITY_MODE ISNOT disable.

Nadler answered 27/4, 2020 at 16:31 Comment(0)
P
0

My current go-to solution:

find $(xcrun simctl get_app_container $deviceId $appId data) -name \*.log | xargs tail -f

where appId is the application identifier, and deviceId is the device identifier (usually booted).

The find command allows for some flexibility in logging libraries, which don't always log to system.log.

Passionate answered 22/5, 2023 at 12:21 Comment(0)
E
-1

Download the safari technology review. With the simulator running, select develop > simulator > localhost

Ecumenicalism answered 30/9, 2020 at 19:16 Comment(0)
M
-3

The easiest way to see the console logs is by adding consolelogs as a param:

ionic cordova run ios -l --consolelogs

And you'll able to see the console logs in your terminal.

Myramyrah answered 2/6, 2021 at 14:22 Comment(0)

© 2022 - 2024 — McMap. All rights reserved.