Let's say I have this very simple loop
for i=1:10
    [xO, yO, xA, yA, xB, yB, xC, yC] = DoSomething(i);
    line([xO,xA,xB,xC],[yO,yA,yB,yC]);
    pause(0.1);
end
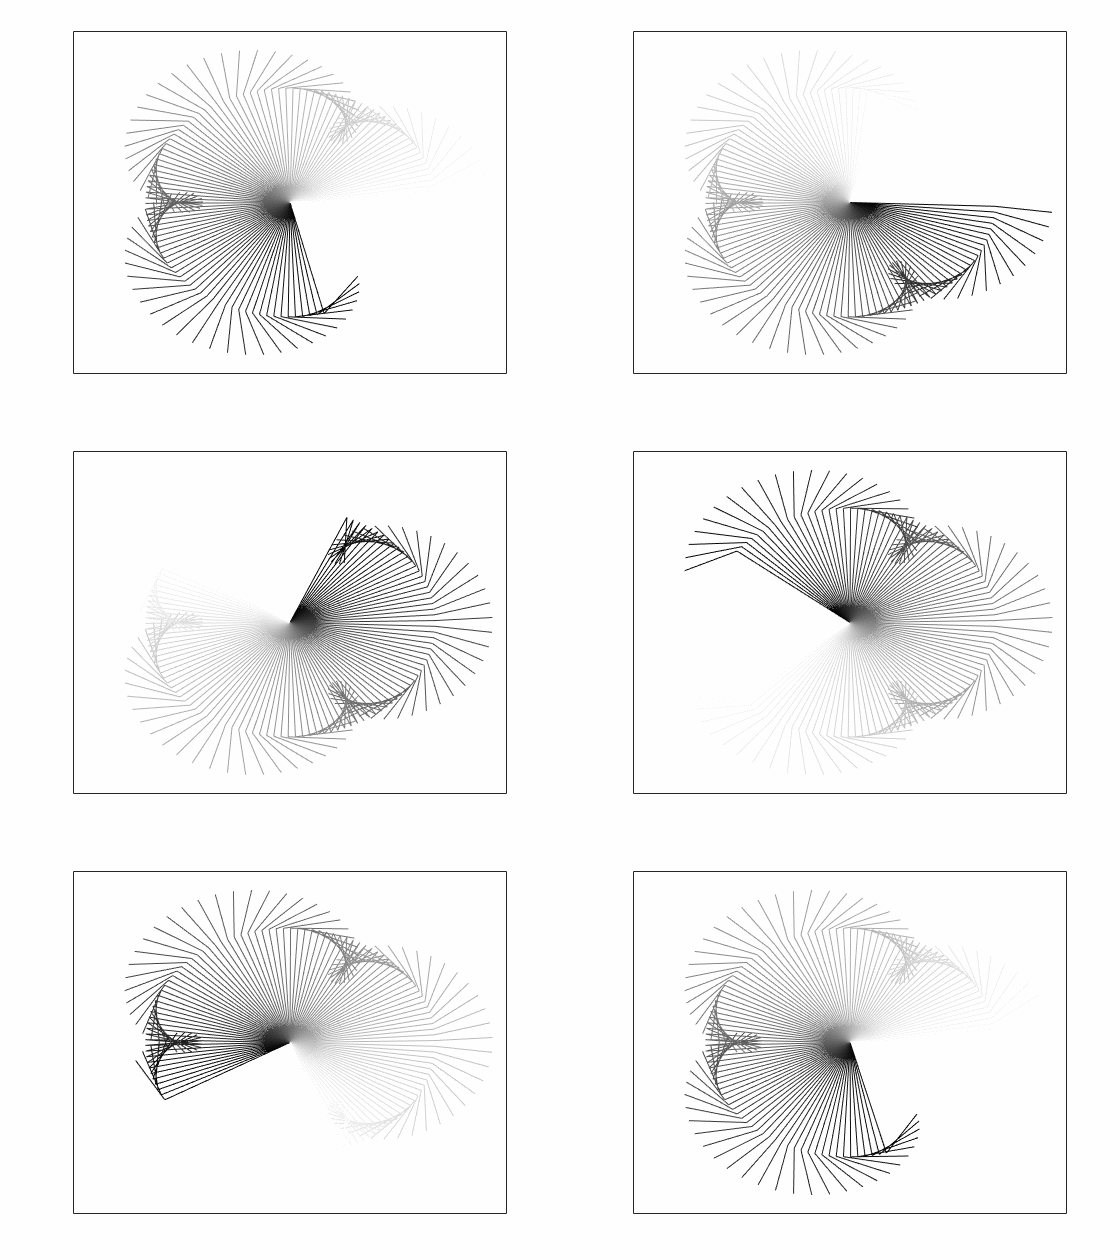
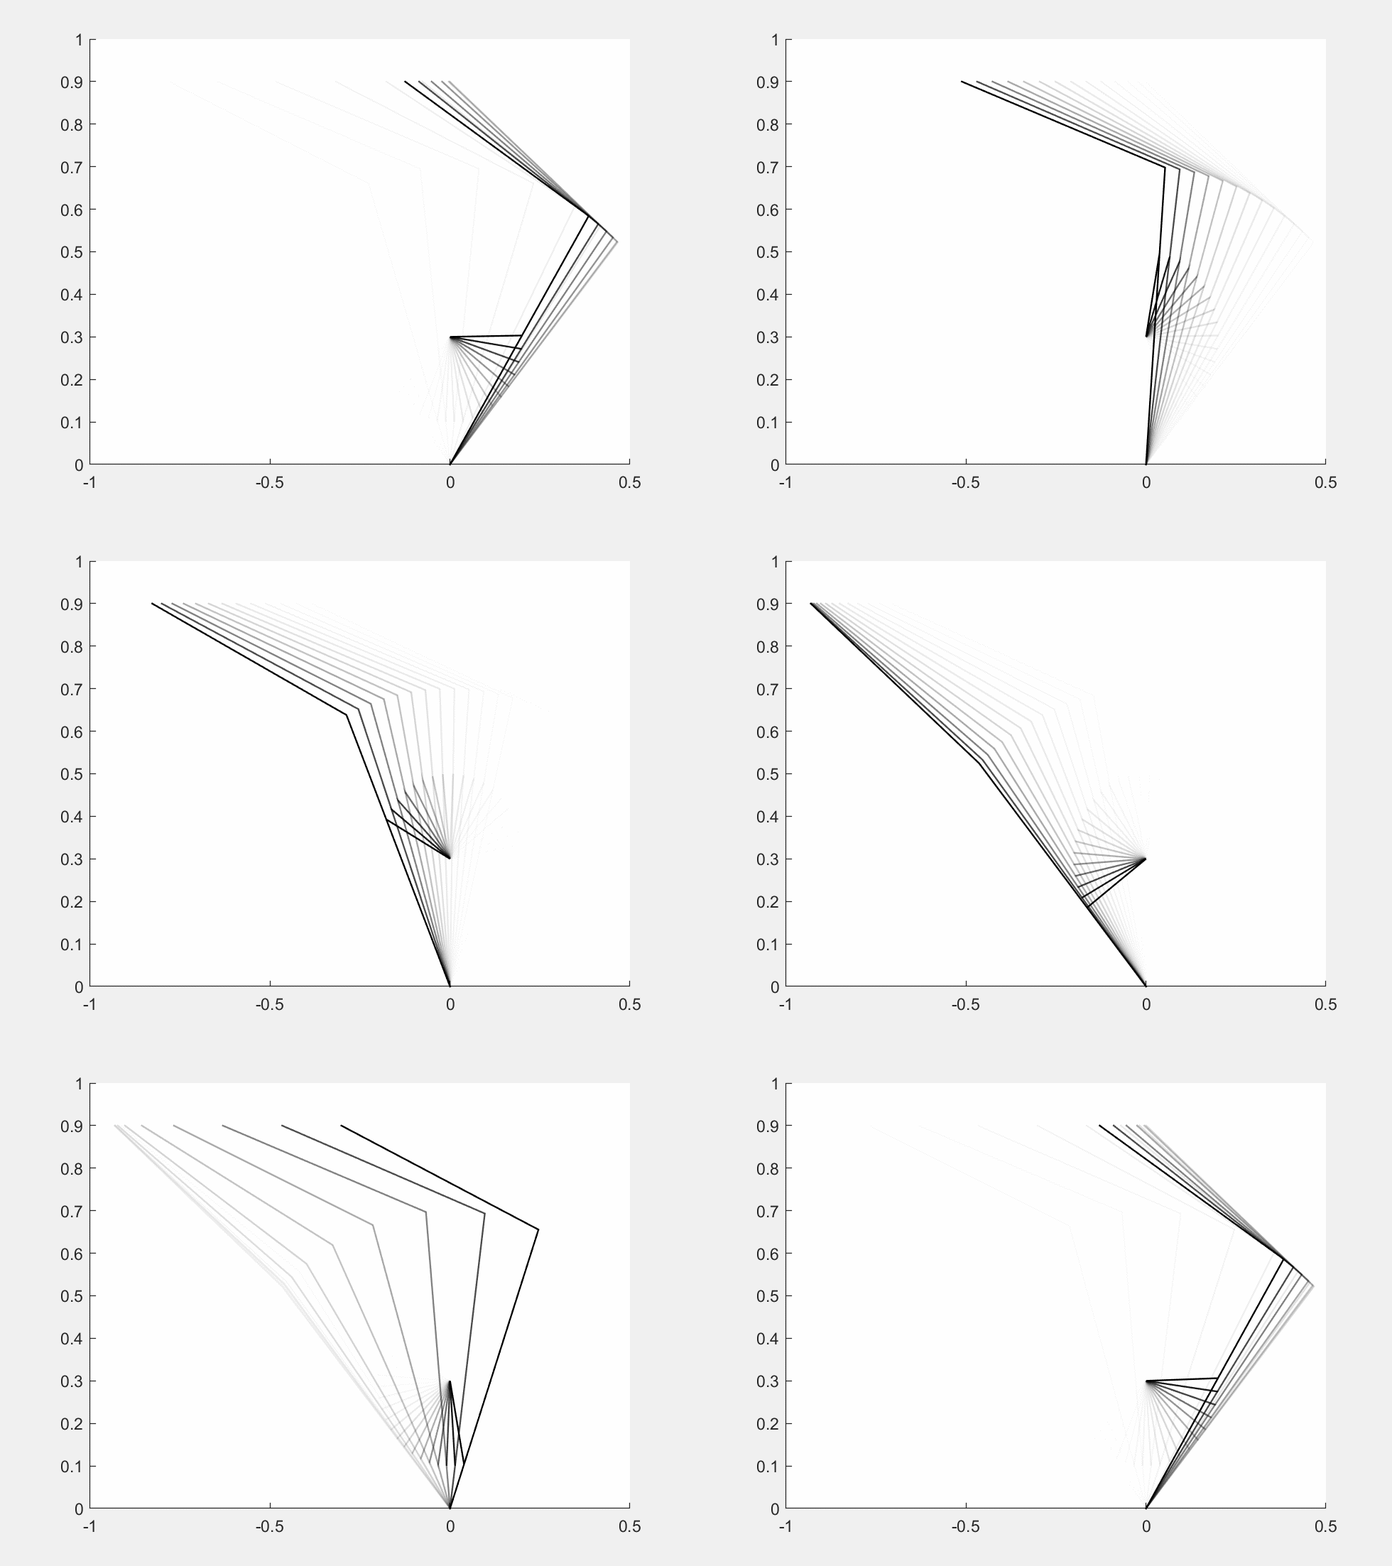
The coordinates that I am plotting correspond to the joints of a multibody system, and I am simulating their positions over time (please see a sample of the plot here):

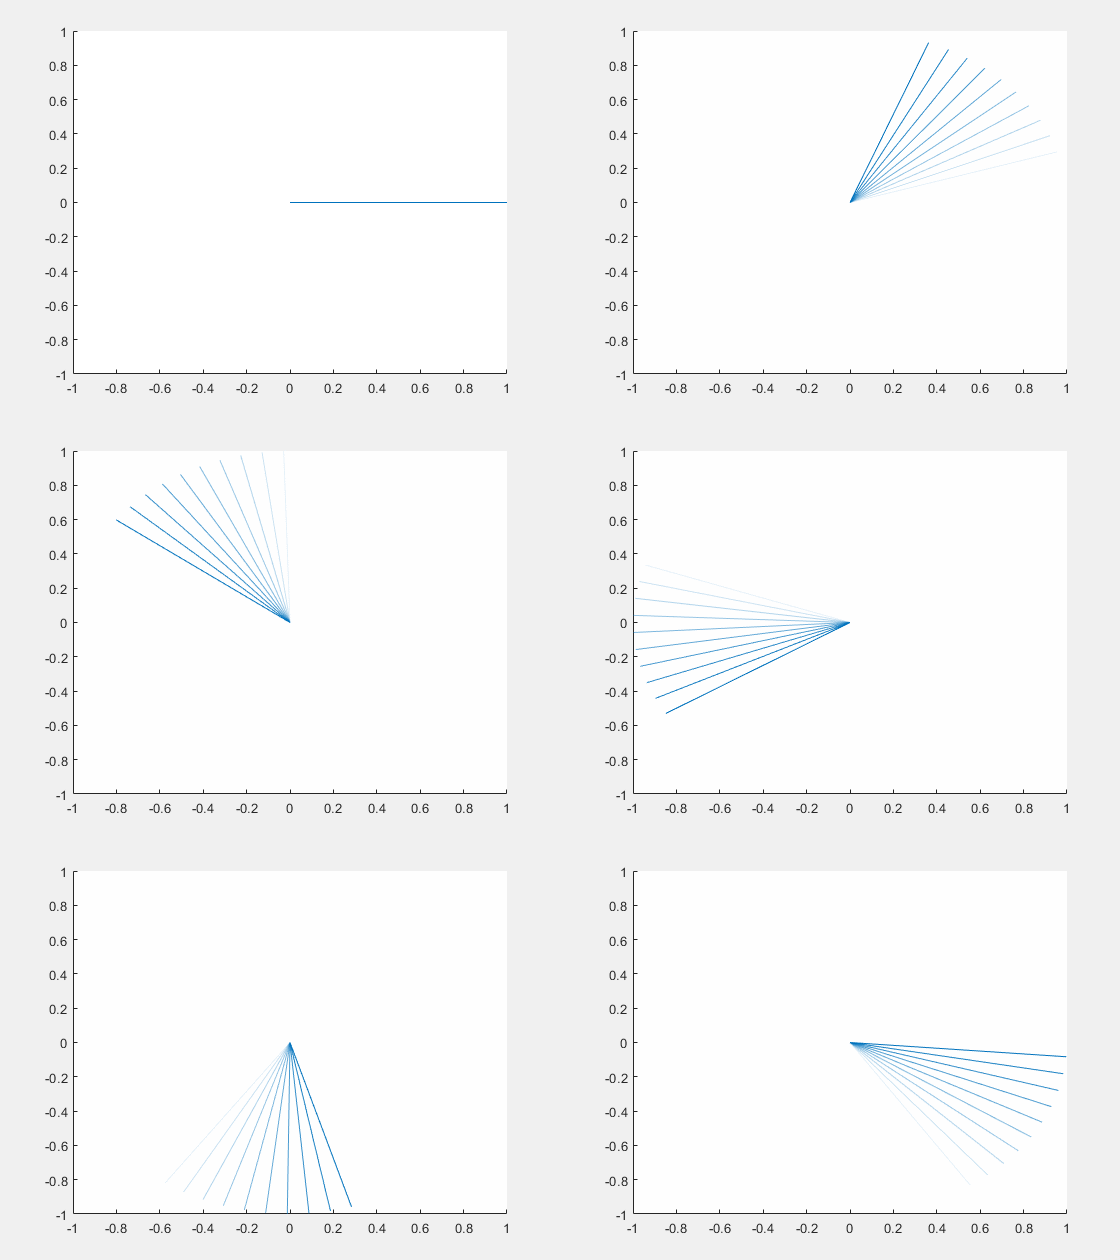
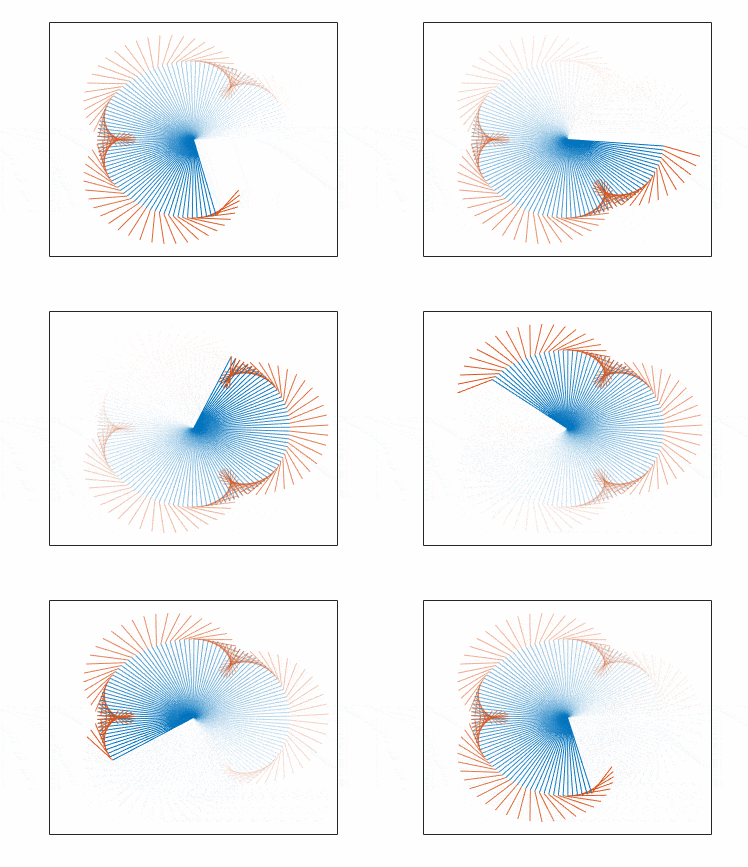
Since some of the links move in a periodic way, it gets confusing to keep track visually of the movement. For this reason, now comes the question: how can I plot the lines in a way that, when a new line is plotted, the previous lines are faded progressively? In other words, so that I have a gradient from the most recently plotted data (most opaque) to the oldest data (increasingly transparent until it completely fades out).
This way when a new line is drawn in the same position as very old data, I will notice that it is a new one.


