Increased number of cache misses when vectorizing code
Asked Answered
M

2

17

I vectorized the dot product between 2 vectors with SSE 4.2 and AVX 2, as you can see below. The code was compiled with GCC 4.8.4 with the -O2 optimization flag. As expected the performance got better with both (and AVX 2 faster than SSE 4.2), but when I profiled the code with PAPI, I found out that the total number of misses (mainly L1 and L2) increased a lot:

Without Vectorization:

PAPI_L1_TCM: 784,112,091
PAPI_L2_TCM: 195,315,365
PAPI_L3_TCM: 79,362

With SSE 4.2:

PAPI_L1_TCM: 1,024,234,171
PAPI_L2_TCM: 311,541,918
PAPI_L3_TCM: 68,842

With AVX 2:

PAPI_L1_TCM: 2,719,959,741
PAPI_L2_TCM: 1,459,375,105
PAPI_L3_TCM: 108,140

Might there be something wrong with my code or is this kind of behavior normal?

AVX 2 code:

double vec_dotProduct(const vec& vecs, const unsigned int& start_a, const unsigned int& start_b, const int& n) {
    double dot = 0;
    register int i = 0;
    const int loopBound = n-3;

    __m256d vsum, vecPi, vecCi, vecQCi;

    vsum = _mm256_set1_pd(0);

    double * const pA = vecs.x+start_a ;
    double * const pB = vecs.x+start_b ;

    for( ; i<loopBound ;i+=4){
        vecPi  = _mm256_loadu_pd(&(pA)[i]);
        vecCi  = _mm256_loadu_pd(&(pB)[i]);
        vecQCi = _mm256_mul_pd(vecPi,vecCi);
        vsum   = _mm256_add_pd(vsum,vecQCi);
    }

    vsum = _mm256_hadd_pd(vsum, vsum);

    dot = ((double*)&vsum)[0] + ((double*)&vsum)[2];

    for( ; i<n; i++)
        dot += pA[i] * pB[i];

    return dot;
}

SSE 4.2 code:

double vec_dotProduct(const vec& vecs, const unsigned int& start_a, const unsigned int& start_b, const int& n) {
    double dot = 0;
    register int i = 0;

    const int loopBound = n-1;

    __m128d vsum, vecPi, vecCi, vecQCi;

    vsum = _mm_set1_pd(0);

    double * const pA = vecs.x+start_a ;
    double * const pB = vecs.x+start_b ;

    for( ; i<loopBound ;i+=2){
        vecPi  = _mm_load_pd(&(pA)[i]);
        vecCi  = _mm_load_pd(&(pB)[i]);
        vecQCi = _mm_mul_pd(vecPi,vecCi);
        vsum   = _mm_add_pd(vsum,vecQCi);
    }

    vsum = _mm_hadd_pd(vsum, vsum);

    _mm_storeh_pd(&dot, vsum);

    for( ; i<n; i++)
        dot += pA[i] * pB[i];

    return dot;
}

Non-vectorized code:

double dotProduct(const vec& vecs, const unsigned int& start_a, const unsigned int& start_b, const int& n) {
    double dot = 0;
    register int i = 0;

    for (i = 0; i < n; ++i)
    {
        dot += vecs.x[start_a+i] * vecs.x[start_b+i];
    }
    return dot;
}

Edit: Assembly of the non-vectorized code:

   0x000000000040f9e0 <+0>:     mov    (%rcx),%r8d
   0x000000000040f9e3 <+3>:     test   %r8d,%r8d
   0x000000000040f9e6 <+6>:     jle    0x40fa1d <dotProduct(vec const&, unsigned int const&, unsigned int const&, int const&)+61>
   0x000000000040f9e8 <+8>:     mov    (%rsi),%eax
   0x000000000040f9ea <+10>:    mov    (%rdi),%rcx
   0x000000000040f9ed <+13>:    mov    (%rdx),%edi
   0x000000000040f9ef <+15>:    vxorpd %xmm0,%xmm0,%xmm0
   0x000000000040f9f3 <+19>:    add    %eax,%r8d
   0x000000000040f9f6 <+22>:    sub    %eax,%edi
   0x000000000040f9f8 <+24>:    nopl   0x0(%rax,%rax,1)
   0x000000000040fa00 <+32>:    mov    %eax,%esi
   0x000000000040fa02 <+34>:    lea    (%rdi,%rax,1),%edx
   0x000000000040fa05 <+37>:    add    $0x1,%eax
   0x000000000040fa08 <+40>:    vmovsd (%rcx,%rsi,8),%xmm1
   0x000000000040fa0d <+45>:    cmp    %r8d,%eax
   0x000000000040fa10 <+48>:    vmulsd (%rcx,%rdx,8),%xmm1,%xmm1
   0x000000000040fa15 <+53>:    vaddsd %xmm1,%xmm0,%xmm0
   0x000000000040fa19 <+57>:    jne    0x40fa00 <dotProduct(vec const&, unsigned int const&, unsigned int const&, int const&)+32>
   0x000000000040fa1b <+59>:    repz retq 
   0x000000000040fa1d <+61>:    vxorpd %xmm0,%xmm0,%xmm0
   0x000000000040fa21 <+65>:    retq   

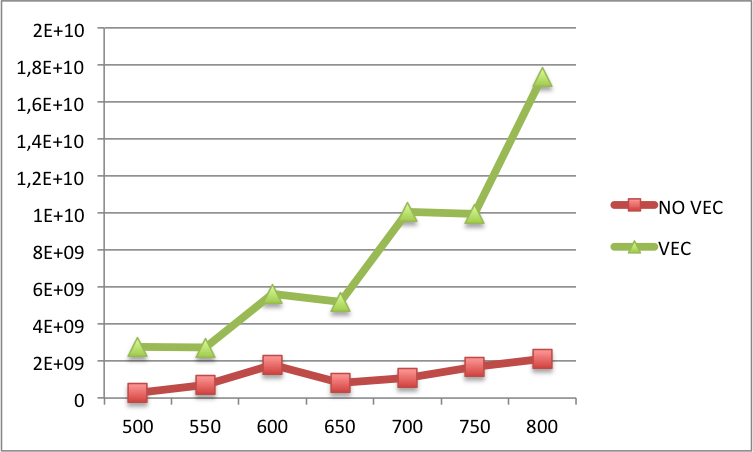
Edit2: Below you can find the comparison of L1 cache misses between the vectorized and the non-vectorized code for bigger N's (N on the x-label and L1 cache misses on the y-label). Basically, for bigger N's there are still more misses in the vectorized version than in the non-vectorized version.

enter image description here

Martine answered 3/12, 2015 at 14:50 Comment(16)
Have you looked at the assembly that your compiler generated (which compiler are you using, by the way?) Perhaps the compiler has also vectorized your code, but did a better job?Geffner
@Geffner I'm using GNU GCC 4.8.4. I forgot to mention but the performance was actually better, even though the number of misses was higher (I will add this to the first post).Martine
We would really need to see the generated code for the first (non-vectorized) case.Makassar
@Rostislav, the OP used -O2 and GCC only vectorizes code with -O3 unless the OP also used ftree-vectorize.Mucous
Could alignment have something to do with this? Are the arrays 16 byte or 32 byte aligned and are start_a and start_a a multiple of 32/sizeof(double)=4? I guess we can assume that it's okay for SSE4.2 since you use aligned load for SSE4.2 but not for AVX2.Mucous
This is my blind guess: in the case of SSE4.2 and AVX, the hardware prefetcher has less time (because of increased performance) to prefetch the next cache line, thus more misses.Guardhouse
What is the size of n?Mucous
@Zboson To be honest, I'm not really sure about the alignment. The array is allocated with new[] and I read somewhere else on Stackoverflow that it automatically aligns the memory. So, I guess that since it works for SSE4.2 and for AVX 2 it doesn't, it might be 16 byte aligned. In this case, n is 500 and not a multiple of 4.Martine
@PaulR I added the assembly of the non-vectorized code to the post.Martine
@Zboson That information was added after I asked the question :)Geffner
n is 500 and not a multiple of 4 500=4*125. Also, your loopBound logic seems wrong. 16byte alignment is not good enough for AVX, but you can get 32byte alignment either by shifting 16bytes if required or _mm_malloc (or _aligned_malloc depending on your system, but beware that you must free that with _mm_free or _aligned_free, respectively).Accouterment
What values of start_a and start_b are you using? Is there overlap? Why don´t you provide a minimum working example or post your full code? It should not be that long.Mucous
@Accouterment What I actually wanted to say was that n might not be a multiple of 4, but yeah, in this particular case it is. Is it also possible to specify the alignment with new?Martine
@Martine NO, you cannot specify the alignment with new.Accouterment
My first thought were along the lines of @IlyaPopov. With vectorization of 2, you essentially double the rate at which you consume what's in the cache. Assuming your RAM can keep up, I'd expect a doubling of the cache misses.Interject
Without changing input sizes, it seems like the ways you could get more cache misses are: Fetching less memory at a time, trying to fetch the same memory multiple times before it's loaded, or an unrelated process could be eating a bunch of your cache during the test. I'm guessing the second one, like Cogwheel and IlyaPopov. Have you tried preloading the 0th elements before the loop, then have the load calls inside always kicking off the prefetch of the element that will be processed on the following iteration? Then it can be fetching during both the arithmetic and loop condition check.Gripping
P
1

Rostislav is right that the compiler is auto-vectorizing, and from the GCC documentation on -O2:

"-O2 Optimize even more. GCC performs nearly all supported optimizations that do not involve a space-speed tradeoff." (from here: https://gcc.gnu.org/onlinedocs/gcc/Optimize-Options.html)

GCC with -O2 flag is attempting to generate the most efficient code, without favoring either code size or speed.

So, in terms of CPU cycles, the -O2 auto-vectorized code will require the fewest watts to run, but will not be the fastest or the smallest code. This is the best case for code that runs on mobile devices and on multi-user systems, and these tend to be the preferred use of C++. If you want absolute maximum speed regardless of how many watts it uses, try -O3 or -Ofast if your version of GCC supports them, or go with your hand-optimized faster solutions.

The cause of this is likely a combination of two factors.

First, faster code generates more requests to the memory/cache within the same amount of time, which stresses the pre-fetch prediction algorithms. L1 cache isn't very large, typically 1MB - 3MB, and is shared among all running processes on that CPU Core, so the CPU Core cannot pre-fetch until the previously pre-fetched block is no longer in use. If the code is running faster, there is less time to pre-fetch between blocks, and in code that pipe-lines effectively, more cache misses will be executed before the CPU Core halts completely until the pending fetches are completed.

And second, modern operating systems typically divide single-threaded processes among multiple cores by adjusting thread affinity dynamically, in order to make use of the extra cache across multiple cores, even though it cannot run any of the code in parallel - e.g. fill core 0's cache with your data and then run it while filling core 1's cache, then run on core 1 while refilling core 0's cache, round-robin until completed. This pseudo-parallelism improves the overall speed of single-threaded processes and should greatly reduce cache misses, but can only be done in very specific circumstances... specific circumstances for which good compilers will generate code whenever possible.

Pelayo answered 28/1, 2016 at 5:39 Comment(0)
H
2

As you can see in some comments, cache misses are coming from the increase of performance.

For instance with recent CPUs, you'll be able to execute 2 AVX2 add or mul at each cycle so 512 bits at each cycle. The time you'll need to load data will be higher as it will require several cache lines.

Also, depending of how your system is configured, hyper threading, affinities etc, your scheduler can do other things at the same time polluting your cache with other threads/processes.

A last thing. CPUs are pretty efficient now to recognize simple patterns as the one you have with very small loops and then will use prefetch automatically after few iterations. It will anyway not be enough to fix the cache size issue.

Have a try with different sizes for N, you should see interesting results. Also, align your data at first and make sure that if you use 2 variables, there are not sharing the same cache line.

Hartal answered 28/1, 2016 at 21:52 Comment(2)
I added a graph for bigger N's to the original post and there are always more misses in the vectorized code than in the non-vectorized code. What kind of interesting results were you referring to?Martine
You can see that if the array is big enough, you can never have the benefit of the prefetch as the CPU calculates much faster than the memory can pull data.google.co.uk/url?sa=t&source=web&rct=j&url=http://…Hartal
P
1

Rostislav is right that the compiler is auto-vectorizing, and from the GCC documentation on -O2:

"-O2 Optimize even more. GCC performs nearly all supported optimizations that do not involve a space-speed tradeoff." (from here: https://gcc.gnu.org/onlinedocs/gcc/Optimize-Options.html)

GCC with -O2 flag is attempting to generate the most efficient code, without favoring either code size or speed.

So, in terms of CPU cycles, the -O2 auto-vectorized code will require the fewest watts to run, but will not be the fastest or the smallest code. This is the best case for code that runs on mobile devices and on multi-user systems, and these tend to be the preferred use of C++. If you want absolute maximum speed regardless of how many watts it uses, try -O3 or -Ofast if your version of GCC supports them, or go with your hand-optimized faster solutions.

The cause of this is likely a combination of two factors.

First, faster code generates more requests to the memory/cache within the same amount of time, which stresses the pre-fetch prediction algorithms. L1 cache isn't very large, typically 1MB - 3MB, and is shared among all running processes on that CPU Core, so the CPU Core cannot pre-fetch until the previously pre-fetched block is no longer in use. If the code is running faster, there is less time to pre-fetch between blocks, and in code that pipe-lines effectively, more cache misses will be executed before the CPU Core halts completely until the pending fetches are completed.

And second, modern operating systems typically divide single-threaded processes among multiple cores by adjusting thread affinity dynamically, in order to make use of the extra cache across multiple cores, even though it cannot run any of the code in parallel - e.g. fill core 0's cache with your data and then run it while filling core 1's cache, then run on core 1 while refilling core 0's cache, round-robin until completed. This pseudo-parallelism improves the overall speed of single-threaded processes and should greatly reduce cache misses, but can only be done in very specific circumstances... specific circumstances for which good compilers will generate code whenever possible.

Pelayo answered 28/1, 2016 at 5:39 Comment(0)

© 2022 - 2024 — McMap. All rights reserved.