Rmarkdown/Bookdown: Separate figure numbering for Supplemental Section
Asked Answered
T

2

17

Certain kinds of documents, such as journal articles, often have a Supplemental Section, where the numbering of figures is different from the main body.

For example, in the main body, you might have Fig 1-5. But then, for the Supplemental section, the numbering restarts as Fig S1, S2, S3, etc.

Bookdown allows cross-referencing (\@ref(fig:label) but I'm not sure how to restart the numbering in a separate section. Is there a good way to do this?

Tsang answered 7/5, 2018 at 22:7 Comment(0)
U
19

You can define a new LaTeX function in the YAML header of your .rmd file as follows:

\newcommand{\beginsupplement}{
  \setcounter{table}{0}  
  \renewcommand{\thetable}{S\arabic{table}} 
  \setcounter{figure}{0} 
  \renewcommand{\thefigure}{S\arabic{figure}}
}

Then type \beginsupplement when you're ready to start labelling the figures and tables with S1, S2... etc. This solution works fine if you export to PDF only, as it uses LaTeX commands to format the output. It therefore will not work for HTML or Word outputs.

---
title: "title"
author:
- My Namington*
- '*\textit{[email protected]} \vspace{5mm}'
output: 
  bookdown::pdf_document2
fontsize: 12pt
header-includes: 
  \usepackage{float} \floatplacement{figure}{H} 
  \newcommand{\beginsupplement}{\setcounter{table}{0}  \renewcommand{\thetable}{S\arabic{table}} \setcounter{figure}{0} \renewcommand{\thefigure}{S\arabic{figure}}}
---

```{r, include=FALSE}
knitr::opts_chunk$set(echo = FALSE)
library(ggplot2)
```


# Main text
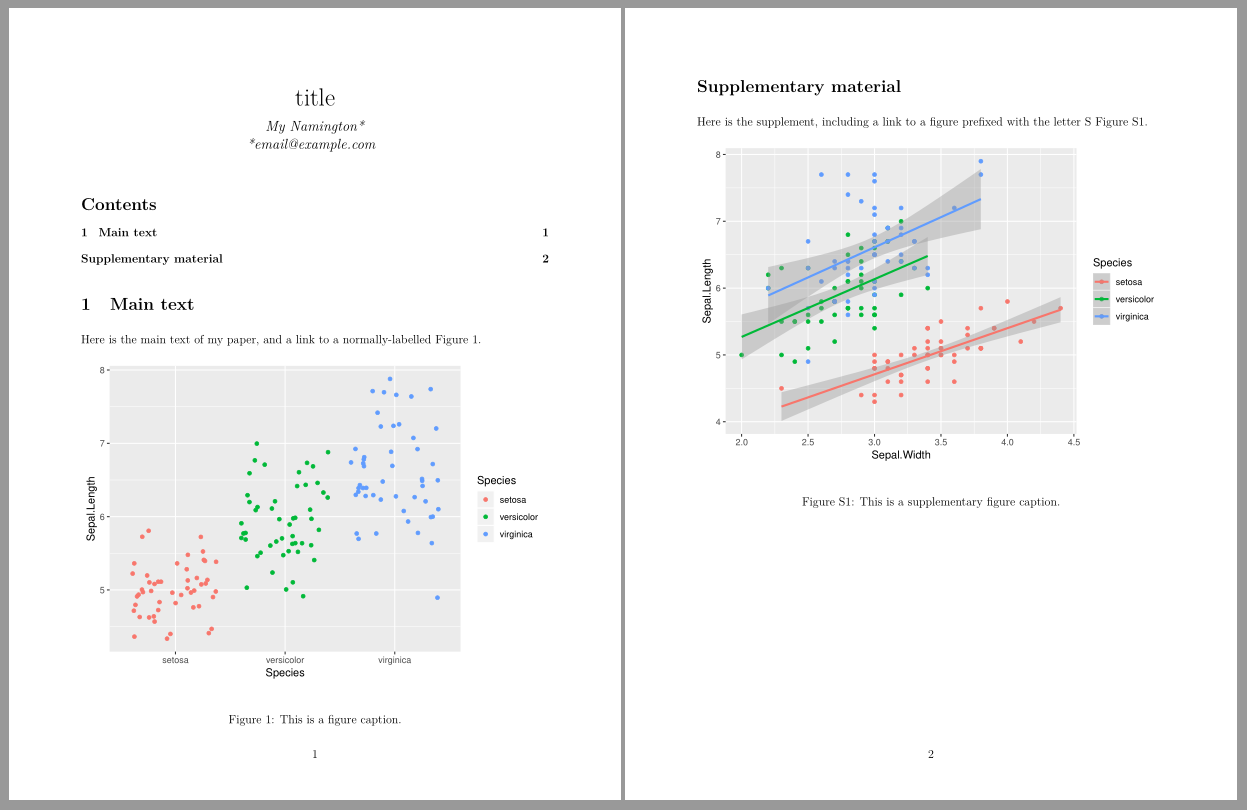
Here is the main text of my paper, and a link to a normally-labelled Figure \@ref(fig:irisPlot).

```{r irisPlot, fig.cap="This is a figure caption."}

ggplot(iris, aes(Species, Sepal.Length, colour = Species)) + geom_jitter()
```

\newpage
# Supplementary material {-}

\beginsupplement


Here is the supplement, including a link to a figure prefixed with the letter S Figure \@ref(fig:irisPlot2).

```{r irisPlot2, echo=FALSE, fig.cap= "This is a supplementary figure caption."}
ggplot(iris, aes(Sepal.Width, Sepal.Length, colour = Species)) + 
    geom_point() + 
    stat_smooth(method = "lm")
```

enter image description here

Unperforated answered 14/7, 2018 at 10:40 Comment(2)
I adjusted the answer a bit to use cross referencing using bookdown and to clarify some of the points (it didn't quite warrant me posting it as my own answer). bookdown.org/yihui/bookdown/cross-references.htmlEmiliaemiliaromagna
Thanks Mike! Maybe I'll get my first answer accepted :)Unperforated
M
1

For those who need something that works for Word DOCX, here is a belated answer, based on this Restart Figure Numbering for Appendix / Supplementary Material in bookdown.

---
output: officedown::rdocx_document
---

```{r setup, include=FALSE}
pacman::p_load(officedown, officer, knitr)
knitr::opts_chunk$set(echo = FALSE)

## Custom function to restart numbering at the start of each new chapter.
## You could also just do this manually!
new_chapter <- function(){
  if(!exists("chapter_count")) chapter_count <<- 0 
  chapter_count <<- chapter_count + 1
  }
```


# Chapter 1: Red section
  
```{r fig.id="red-plot1"}
new_chapter()
barplot(1:8, col = "red4")

block_caption("Some red bars",
              style = "Figure",
              autonum = run_autonum(seq_id = 'fig', 
                                    start_at = 1, ##restart
                                    bkm = 'red-plot1',
                                    pre_label = paste0("Figure ", chapter_count, ".")))
```

Figure `r chapter_count`.\@ref(fig:red-plot1) shows some red bars.

# Chapter 2 : Blue section
```{r fig.id="blue-plot1"}
new_chapter()
barplot(1:8, col = "dodgerblue3")

block_caption("Some blue bars",
              style = "Figure",
              autonum = run_autonum(seq_id = 'fig', 
                                    start_at = 1, ##restart
                                    bkm = 'blue-plot1',
                                    pre_label = paste0("Figure ", chapter_count, ".")))
```

Figure `r chapter_count`.\@ref(fig:blue-plot1) shows some blue bars.

```{r fig.id="blue-plot2"}
barplot(8:1, col = "dodgerblue3")

block_caption("More blue bars",
              style = "Figure",
              autonum = run_autonum(seq_id = 'fig', 
                                    bkm = 'blue-plot2',
                                    pre_label = paste0("Figure ", chapter_count, ".")))
```


Figure `r chapter_count`.\@ref(fig:blue-plot2) shows some more blue bars.

# Supplementary section

```{r fig.id="supp-plot1"}
barplot(1:4, main = "Supplementary bars" )

block_caption("Some supplementary bars",
              style = "Figure",
              autonum = run_autonum(seq_id = 'fig', 
                                    start_at = 1, ##restart count
                                    bkm = 'supp-plot1',
                                    pre_label = "Figure S"))
```

Figure S\@ref(fig:supp-plot1) shows some supplementary bars
Merridie answered 21/10, 2021 at 20:25 Comment(0)

© 2022 - 2024 — McMap. All rights reserved.