Redraw a figure saved in 2013b in 2014b
Asked Answered
E

1

19

As MATLAB has changed its figure engine in R2014b I decided to rerun some of my code for getting better looking figures out of them. Unfortunately, the last one I have is a code that takes ages to run, and I would like to highly avoid to rerun the code for a nicer figure.

I saved the result in a .fig file in R2013b. However, if I open it in R2014b, it still has the old format.

Is it possible to redraw the figure using the MATLAB R2014b plotting engine? If it is, how could I do it?

NOTE: Literally, the figure is opened and drawn with the new engine, however, it retains its old format. While a new figure with a title() command would plot a nice big, bold title, if a redraw this figure using "drawnow" or I generate code for it, the format remains the same.

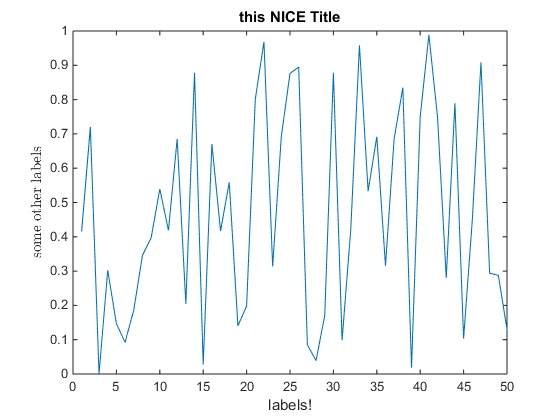
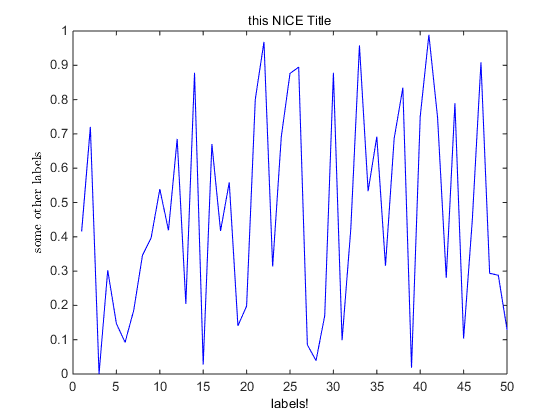
Example: This figure was created in 2013b, and redrawn in 2014b. You can see that the title does not plot in the same format as a title('whatever') would plot in the new graphic handles. It looks like that a '.fig' saves and sets the default values for the version it has been generated. Thus plot colors, titles, labels etc will look like the old graphic handles when redrawn.

enter image description here

This can be tested with the following code. Note that this is an overly simplified problem, the question is not explicitly about titles or labels, but all graphic stuff in general.

rng(1)


figure()
x = 1:50;
y = rand(1, 50);

plot(x,y)
title('this NICE Title')
xlabel('labels!')
ylabel('some other labels','Interpreter','Latex')

If this code is run in 2013b and 2014b, saved as fig in both and then opened as fig in both, the next 2 figures appear:

enter image description here enter image description here

The 2013b fig file: http://s000.tinyupload.com/index.php?file_id=02053933004513599550

Egyptology answered 7/11, 2014 at 12:35 Comment(21)
drawnow doesn't do anything? Also, is it a simple plot (plot or scatter output?). If so you can get the data out of the figure quite easily. (Contours or something like that-- not so easy).Instancy
@Instancy definitely is not an easy plot. It has 12 subplots with different amount of data on them.Egyptology
Can you upload the original .fig somewhere?Event
@AnderBiguri: can you try using copyobj? Something along the lines of this: https://mcmap.net/q/668435/-producing-subplots-and-then-combine-them-into-a-figure-later-in-matlabRidinger
alright, I'm deleting my comments. Sorry for hijacking the threadRidinger
@Ridinger How would I use copyoct in this case? The figure is saved in a folder, its not a variable in the workspace.Egyptology
@AnderBiguri: My idea was to first hgload the figure, and then use copyobj on it to create a new copy out of it in the hope that it gets rendered with the new graphics system... Anyway I just tried reproducing the problem on my end and I coudnt; I used a simple plot saved in R2014a, and then load it the FIG-file in R2014b and it was rendered with the new graphics (smoothed lines and new colors and all)... Can you share the original FIG-file which is causing the problem, or at least create a simpler one that showcases the issue?Ridinger
@Ridinger Actually the smoothed lines and that is happening, but font size, default colors and so its not. Try to save 2 subplots with 3 data lines together. Anyway, probably I will just manually change the settings (colors, fonts, ...) of the figure.Egyptology
What if you load the figure and use File -> Generate Code.... It will give you an m-file which replicates the plot, including the colours and fonts used when it was saved. You can then remove the lines pertaining to font sizes and colours and run the m-file. Can't test this myself because I don't have an old copy of MATLAB handy.Hypoblast
@transversalitycondition nah, tried that.(see post). The generate code didn't set some of the things. I think there is no real solutions to this, just figures are not 100% backwards and forwards compatibleEgyptology
Have you looked there? mathworks.com/matlabcentral/answers/…Alchemist
@Alchemist but that will not work in a case where ther are titles, annotations, 5 types of data, arrows, xtick and ytick, etc, right? It will work if manually one types everything that needs to be extracted, but that is extremely tediousEgyptology
You could maybe loop over the children of the main axes (i.e. 12 subaxes if you have 12 subplots), and for each child loop over the children again to detect datas by detecting the type of the elements you getAlchemist
Would it be possible for you to share your .fig file? I'd have fun trying to do itAlchemist
Found something there also (about the structure of simple figs) : undocumentedmatlab.com/blog/fig-files-formatAlchemist
And here's about getting data from a subplot : mathworks.com/matlabcentral/newsreader/view_thread/290029Alchemist
@Alchemist check the update.Egyptology
Well, i have no idea if i'll be able to do it or not, but i'll definitely have fun trying! (Maybe start a chat on the subject to share the progress?)Alchemist
Do you also have customized ticklabels and tickmarks?Alchemist
@Alchemist yeah. The idea in general is: Whatever one has customized, that shoudl get as it is, but is something has left default, then that one should be drawn with the new default. More or less.Egyptology
Well, i could't finish it today, but i have a good feeling that everything can be done dynamicallyAlchemist
H
6

There is a roundabout way for doing this -- just using hgopen for loading the figure and then extracting the data to re-plot it in 2014b:

h1=hgopen('test.fig');              % h1 = handle to the figure
allaxes=get(h1,'children');         % allaxes = array with axes handles 
for a=1:length(allaxes)
    ax=allaxes(a);
    allines=get(ax,'children');     % all lines in current axes
    for l=1:length(allines)
        lin=allines(l);
        values=get(lin,'ydata');    % values of the current line
        subplots{a}{l}=values;
    end
end

You can then use the subplots cell array to make the plots again by hand. It is a boring way to do it, but may be worth trying if re-generating the output takes very long.

Humanism answered 20/10, 2015 at 8:30 Comment(0)

© 2022 - 2024 — McMap. All rights reserved.