I wrote a simple matrix multiplication to test out multithreading/parallelization capabilities of my network and I noticed that the computation was much slower than expected.
The Test is simple : multiply 2 matrices (4096x4096) and return the computation time. Neither the matrices nor results are stored. The computation time is not trivial (50-90secs depending on your processor).
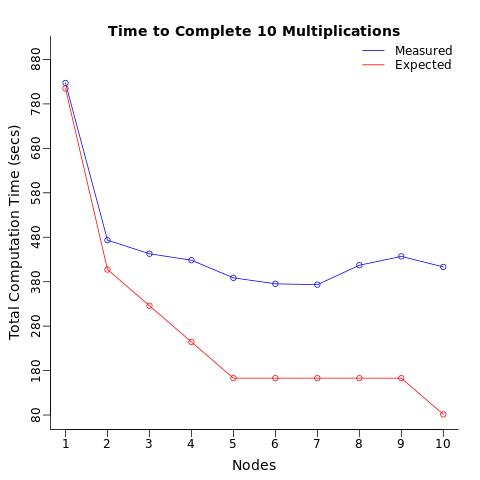
The Conditions : I repeated this computation 10 times using 1 processor, split these 10 computations to 2 processors (5 each), then 3 processors, ... up to 10 processors (1 computation to each processor). I expected the total computation time to decrease in stages, and i expected 10 processors to complete the computations 10 times as fast as it takes one processor to do the same.
The Results : Instead what i got was only a 2 fold reduction in computation time which is 5 times SLOWER than expected.
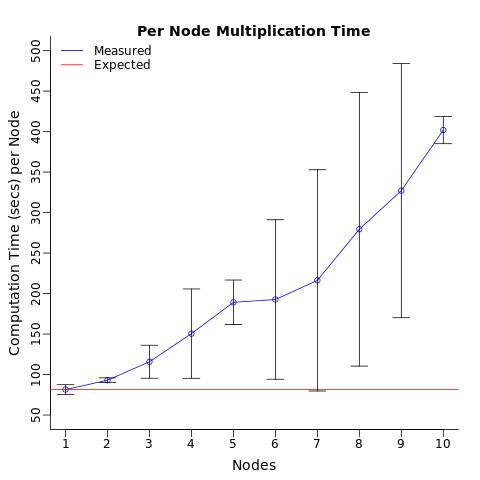
When i computed the average computation time per node, i expected each processor to compute the test in the same amount of time (on average) regardless of the number of processors assigned. I was surprised to see that merely sending the same operation to multiple processor was slowing down the average computation time of each processor.
Can anyone explain why this is happening?
Note this is question is NOT a duplicate of these questions:
foreach %dopar% slower than for loop
or
Why is the parallel package slower than just using apply?
Because the test computation is not trivial (ie 50-90secs not 1-2secs), and because there is no communication between processors that i can see (i.e. no results are returned or stored other than the computation time).
I have attached the scripts and functions bellow for replication.
library(foreach); library(doParallel);library(data.table)
# functions adapted from
# http://www.bios.unc.edu/research/genomic_software/Matrix_eQTL/BLAS_Testing.html

Matrix.Multiplier <- function(Dimensions=2^12){
  # Creates a matrix of dim=Dimensions and runs multiplication
  #Dimensions=2^12
  m1 <- Dimensions; m2 <- Dimensions; n <- Dimensions;
  z1 <- runif(m1*n); dim(z1) = c(m1,n)
  z2 <- runif(m2*n); dim(z2) = c(m2,n)
  a <- proc.time()[3]
  z3 <- z1 %*% t(z2)
  b <- proc.time()[3]
  c <- b-a
  names(c) <- NULL
  rm(z1,z2,z3,m1,m2,n,a,b);gc()
  return(c)
}

Nodes <- 10
Results <- NULL
for(i in 1:Nodes){
  cl <- makeCluster(i)
  registerDoParallel(cl)
  ptm <- proc.time()[3]
  i.Node.times <- foreach(z=1:Nodes,.combine="c",.multicombine=TRUE,
                          .inorder=FALSE) %dopar% {
                            t <- Matrix.Multiplier(Dimensions=2^12)
                          }
  etm <- proc.time()[3]
  i.TotalTime <- etm-ptm
  i.Times <- cbind(Operations=Nodes,Node.No=i,Avr.Node.Time=mean(i.Node.times),
                   sd.Node.Time=sd(i.Node.times),
                   Total.Time=i.TotalTime)
  Results <- rbind(Results,i.Times)
  rm(ptm,etm,i.Node.times,i.TotalTime,i.Times)
  stopCluster(cl)
}
library(data.table)
Results <- data.table(Results)
Results[,lower:=Avr.Node.Time-1.96*sd.Node.Time]
Results[,upper:=Avr.Node.Time+1.96*sd.Node.Time]
Exp.Total <- c(Results[Node.No==1][,Avr.Node.Time]*10,
               Results[Node.No==1][,Avr.Node.Time]*5,
               Results[Node.No==1][,Avr.Node.Time]*4,
               Results[Node.No==1][,Avr.Node.Time]*3,
               Results[Node.No==1][,Avr.Node.Time]*2,
               Results[Node.No==1][,Avr.Node.Time]*2,
               Results[Node.No==1][,Avr.Node.Time]*2,
               Results[Node.No==1][,Avr.Node.Time]*2,
               Results[Node.No==1][,Avr.Node.Time]*2,
               Results[Node.No==1][,Avr.Node.Time]*1)
Results[,Exp.Total.Time:=Exp.Total]

jpeg("Multithread_Test_TotalTime_Results.jpeg")
par(oma=c(0,0,0,0)) # set outer margin to zero
par(mar=c(3.5,3.5,2.5,1.5)) # number of lines per margin (bottom,left,top,right)
plot(x=Results[,Node.No],y=Results[,Total.Time],  type="o", xlab="", ylab="",ylim=c(80,900),
     col="blue",xaxt="n", yaxt="n", bty="l")
title(main="Time to Complete 10 Multiplications", line=0,cex.lab=3)
title(xlab="Nodes",line=2,cex.lab=1.2,
      ylab="Total Computation Time (secs)")
axis(2, at=seq(80, 900, by=100), tick=TRUE, labels=FALSE)
axis(2, at=seq(80, 900, by=100), tick=FALSE, labels=TRUE, line=-0.5)
axis(1, at=Results[,Node.No], tick=TRUE, labels=FALSE)
axis(1, at=Results[,Node.No], tick=FALSE, labels=TRUE, line=-0.5)
lines(x=Results[,Node.No],y=Results[,Exp.Total.Time], type="o",col="red")
legend('topright','groups',
       legend=c("Measured", "Expected"), bty="n",lty=c(1,1),
       col=c("blue","red"))
dev.off()

jpeg("Multithread_Test_PerNode_Results.jpeg")
par(oma=c(0,0,0,0)) # set outer margin to zero
par(mar=c(3.5,3.5,2.5,1.5)) # number of lines per margin (bottom,left,top,right)
plot(x=Results[,Node.No],y=Results[,Avr.Node.Time],  type="o", xlab="", ylab="",
     ylim=c(50,500),col="blue",xaxt="n", yaxt="n", bty="l")
title(main="Per Node Multiplication Time", line=0,cex.lab=3)
title(xlab="Nodes",line=2,cex.lab=1.2,
      ylab="Computation Time (secs) per Node")
axis(2, at=seq(50,500, by=50), tick=TRUE, labels=FALSE)
axis(2, at=seq(50,500, by=50), tick=FALSE, labels=TRUE, line=-0.5)
axis(1, at=Results[,Node.No], tick=TRUE, labels=FALSE)
axis(1, at=Results[,Node.No], tick=FALSE, labels=TRUE, line=-0.5)
abline(h=Results[Node.No==1][,Avr.Node.Time], col="red")
epsilon = 0.2
segments(Results[,Node.No],Results[,lower],Results[,Node.No],Results[,upper])
segments(Results[,Node.No]-epsilon,Results[,upper],
         Results[,Node.No]+epsilon,Results[,upper])
segments(Results[,Node.No]-epsilon, Results[,lower],
         Results[,Node.No]+epsilon,Results[,lower])
legend('topleft','groups',
       legend=c("Measured", "Expected"), bty="n",lty=c(1,1),
       col=c("blue","red"))
dev.off()
EDIT : Response @Hong Ooi's comment
I used lscpu in UNIX to get;
Architecture:          x86_64
CPU op-mode(s):        32-bit, 64-bit
Byte Order:            Little Endian
CPU(s):                30
On-line CPU(s) list:   0-29
Thread(s) per core:    1
Core(s) per socket:    1
Socket(s):             30
NUMA node(s):          4
Vendor ID:             GenuineIntel
CPU family:            6
Model:                 63
Model name:            Intel(R) Xeon(R) CPU E5-2630 v3 @ 2.40GHz
Stepping:              2
CPU MHz:               2394.455
BogoMIPS:              4788.91
Hypervisor vendor:     VMware
Virtualization type:   full
L1d cache:             32K
L1i cache:             32K
L2 cache:              256K
L3 cache:              20480K
NUMA node0 CPU(s):     0-7
NUMA node1 CPU(s):     8-15
NUMA node2 CPU(s):     16-23
NUMA node3 CPU(s):     24-29
EDIT : Response to @Steve Weston's comment.
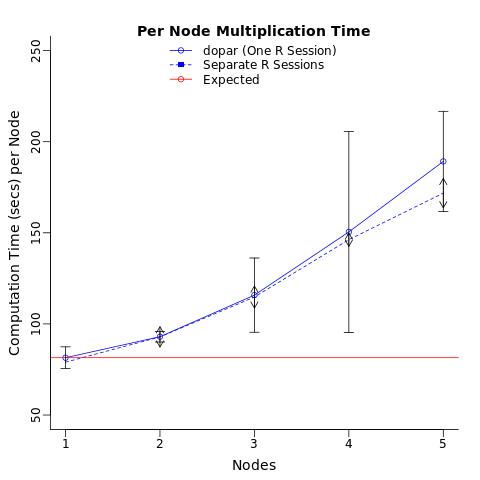
I am using a virtual machine network (but I'm not the admin) with access to up to 30 clusters. I ran the test you suggested. Opened up 5 R sessions and ran the matrix multiplication on 1,2...5 simultaneously (or as quickly as i could tab over and execute). Got very similar results to before (re: each additional process slows down all individual sessions). Note i checked memory usage using top and htop and the usage never exceeded 5% of the network capacity (~2.5/64Gb).
CONCLUSIONS:
The problem seems to be R specific. When i run other multi-threaded commands with other software (e.g. PLINK) i don't run into this problem and parallel process run as expected. I have also tried running the above with Rmpi and doMPI with same (slower) results. The problem appears to be related R sessions/parallelized commands on virtual machine network. What i really need help on is how to pinpoint the problem. Similar problem seems to be pointed out here


lscpuin at the bottom. Does this help? – Disengageforkclusters instead ofpsockclusters (the default)? It should reduce the I/O overhead... Your printout also has really small L1 and L2 caches. You're probably experiencing a huge number of cache misses, which slows things down tremendously. I'm pretty sure cache misses increase with parallelization (though I'd have to check). – Skiagraph