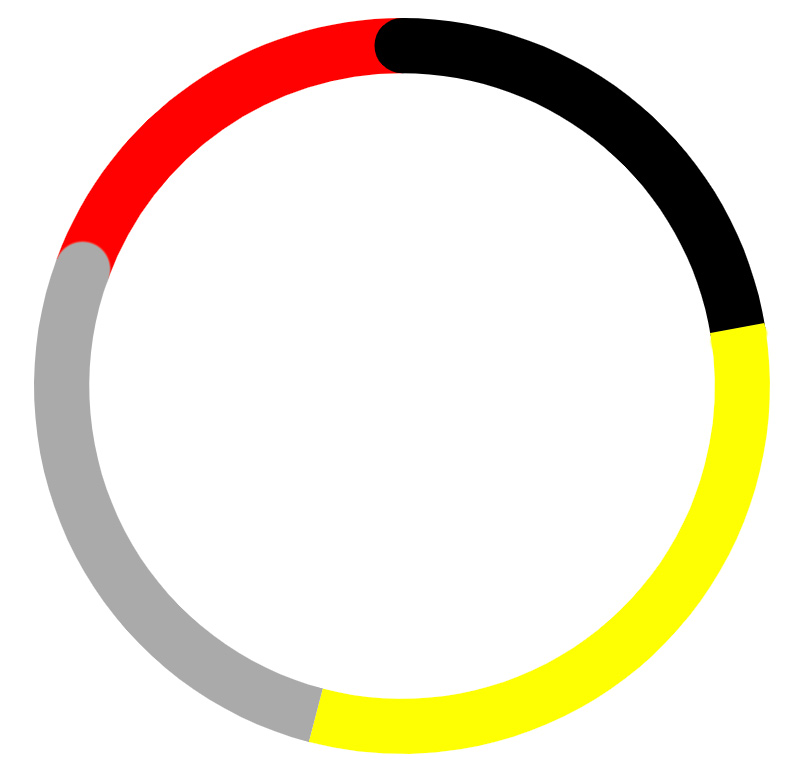
I know there are a few answer for this, but it seems this one is a bit different. I need to change doughnut chart, rounded the first one and the last but one too. So in my example the black (first dataset) only would be rounded on the beginning (one side) and the gray (last but one) would be rounded at the end, like on the picture.

Of course, this is the latest version (v3) of Chart.js.
I used some code from here: Chart.js Doughnut with rounded edges and text centered
Maybe it's better with a custom chart, but I couldn't even get this far with that.
This is my code so far. Only makes rounded the first dataset and unfortunately both sided of it.
Chart.defaults.elements.arc.borderWidth = 0;
Chart.defaults.elements.arc.roundedCornersFor = 0;
Chart.defaults.elements.arc.hoverBorderColor = 'white';

Chart.defaults.datasets.doughnut.cutout = '85%';

var doughnutChart = document.getElementById('doughnutChart');

if(doughnutChart) {
    new Chart(doughnutChart, {
        type: 'doughnut',

        // The data for our dataset
        data: {
            labels: [
                'Label 1',
                'Label 2',
                'Label 3',
                'Label 4'
              ],
              datasets: [{
                label: 'My First Dataset',
                data: [22, 31, 26, 19],
                backgroundColor: [
                  '#000000',
                  '#ffff00',
                  '#aaaaaa',
                  '#ff0000'
                ]
            }]
        },
        plugins: [
            {
                afterUpdate: function(chart) {
                    if (chart.options.elements.arc.roundedCornersFor !== undefined) {
                        var arc = chart.getDatasetMeta(0).data[chart.options.elements.arc.roundedCornersFor];

                        arc.round = {
                            x: (chart.chartArea.left + chart.chartArea.right) / 2,
                            y: (chart.chartArea.top + chart.chartArea.bottom) / 2,
                            radius: (arc.outerRadius + arc.innerRadius) / 2,
                            thickness: (arc.outerRadius - arc.innerRadius) / 2,
                            backgroundColor: arc.options.backgroundColor
                        }
                    }
                },
                afterDraw: (chart) => {
                    if (chart.options.elements.arc.roundedCornersFor !== undefined) {
                        var {ctx, canvas} = chart;
                        var arc = chart.getDatasetMeta(0).data[chart.options.elements.arc.roundedCornersFor];

                        var startAngle = Math.PI / 2 - arc.startAngle;
                        var endAngle = Math.PI / 2 - arc.endAngle;

                        ctx.save();
                        ctx.translate(arc.round.x, arc.round.y);
                        ctx.fillStyle = arc.round.backgroundColor;
                        ctx.beginPath();
                        ctx.arc(arc.round.radius * Math.sin(startAngle), arc.round.radius * Math.cos(startAngle), arc.round.thickness, 0, 2 * Math.PI);
                        ctx.arc(arc.round.radius * Math.sin(endAngle), arc.round.radius * Math.cos(endAngle), arc.round.thickness, 0, 2 * Math.PI);
                        ctx.closePath();
                        ctx.fill();
                        ctx.restore();
                    }
                }
            }
        ]
    });
}
.container {
width: 400px;
}<script src="https://cdnjs.cloudflare.com/ajax/libs/Chart.js/3.3.2/chart.min.js"></script>
<div class="container">
<canvas id="doughnutChart"></canvas>
</div>