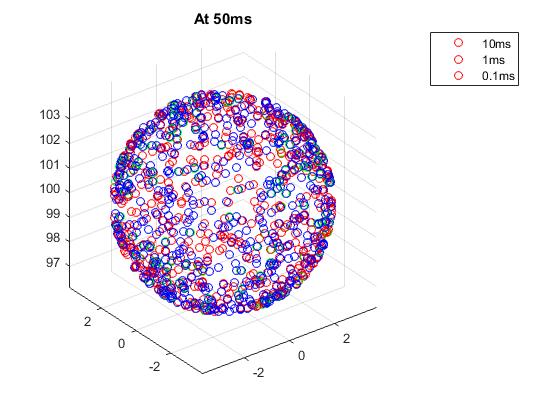
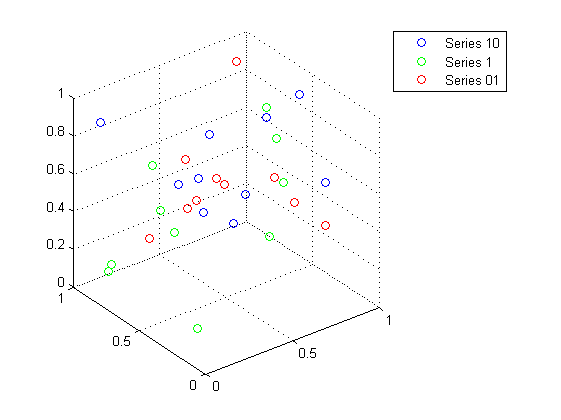
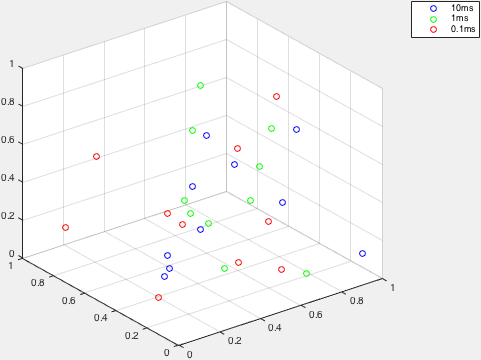
I want to place three scatter plots in the same figure window and have a legend that describes them. The scatter plots all load in the same window just fine, but the legend only recognizes the last series. In other words, the legend shows a red marker (the color for the last series) for each of its entries.
How do I make the legend recognize each scatter and not just the last one? I've tried a bunch of different things, and none of them seem to work. Thanks!
The picture is the plot for one of my datasets, note the legend.
s10 = scatter3(x1, y1, z1, 'b'); hold on;
s1 = scatter3(x2, y2, z2, 'g'); hold on;
s01 = scatter3(x3, y3, z3, 'r'); hold on;
legend([s10,s1,s01], {'10ms', '1ms', '0.1ms'})
% Every legend entry is red (pertains to the last series)


