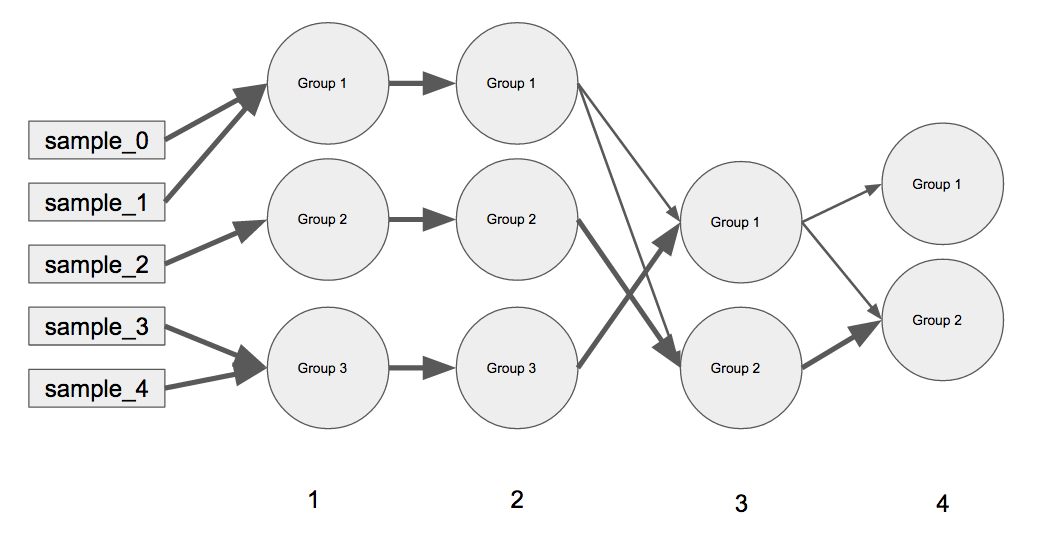
I am trying create a linear network graph using Python (preferably with matplotlib and networkx although would be interested in bokeh) similar in concept to the one below.
How can this graph plot be constructed efficiently (pos?) in Python using networkx? I want to use this for more complicated examples so I feel that hard coding the positions for this simple example won't be useful :( . Does networkx have a solution to this?
I haven't seen any tutorials on how this can be achieved in networkx which is why I believe this question will be a reliable resource for the community. I've extensively gone through the networkx tutorials and nothing like this is on there. The layouts for networkx would make this type of network impossible to interpret without careful use of the pos argument... which I believe is my only option. None of the precomputed layouts on the https://networkx.github.io/documentation/networkx-1.9/reference/drawing.html documentation seem to handle this type of network structure well.
Simple Example:
(A) every outer key is the iteration in the graph moving from left to the right (e.g. iteration 0 represents samples, iteration 1 has groups 1 - 3, same with iteration 2, iteration 3 has Groups 1 - 2, etc.). (B) The inner dictionary contains the current grouping at that particular iteration, and the weights for the previous groups merging that represent the current group (e.g. iteration 3 has Group 1 and Group 2 and for iteration 4 all of iteration 3's Group 2 has gone into iteration 4's Group 2 but iteration 3's Group 1 has been split up. The weights always sum to 1.
My code for the connections w/ weights for the plot above:
D_iter_current_previous =    {
        1: {
            "Group 1":{"sample_0":0.5, "sample_1":0.5, "sample_2":0, "sample_3":0, "sample_4":0},
            "Group 2":{"sample_0":0, "sample_1":0, "sample_2":1, "sample_3":0, "sample_4":0},
            "Group 3":{"sample_0":0, "sample_1":0, "sample_2":0, "sample_3":0.5, "sample_4":0.5}
            },
        2: {
            "Group 1":{"Group 1":1, "Group 2":0, "Group 3":0},
            "Group 2":{"Group 1":0, "Group 2":1, "Group 3":0},
            "Group 3":{"Group 1":0, "Group 2":0, "Group 3":1}
            },
        3: {
            "Group 1":{"Group 1":0.25, "Group 2":0, "Group 3":0.75},
            "Group 2":{"Group 1":0.25, "Group 2":0.75, "Group 3":0}
            },
        4: {
            "Group 1":{"Group 1":1, "Group 2":0},
            "Group 2":{"Group 1":0.25, "Group 2":0.75}
            }
        }
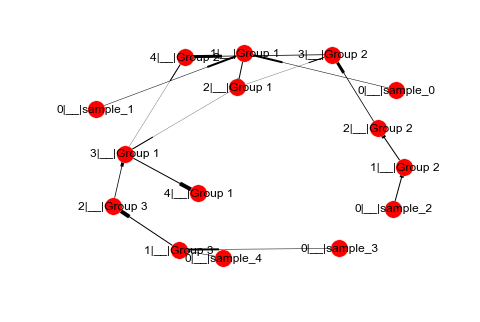
This is what happened when I made the Graph in networkx:
import networkx
import matplotlib.pyplot as plt

# Create Directed Graph
G = nx.DiGraph()

# Iterate through all connections
for iter_n, D_current_previous in D_iter_current_previous.items():
    for current_group, D_previous_weights in D_current_previous.items():
        for previous_group, weight in D_previous_weights.items():
            if weight > 0:
                # Define connections using `|__|` as a delimiter for the names
                previous_node = "%d|__|%s"%(iter_n - 1, previous_group)
                current_node = "%d|__|%s"%(iter_n, current_group)
                connection = (previous_node, current_node)
                G.add_edge(*connection, weight=weight)

# Draw Graph with labels and width thickness
nx.draw(G, with_labels=True, width=[G[u][v]['weight'] for u,v in G.edges()])
Note: The only other way, I could think of to do this would be in matplotlib creating a scatter plot with every tick representing a iteration (5 including the initial samples) then connecting the points to each other with different weights. This would be some pretty messy code especially trying to line up the edges of the markers w/ the connections...However, I'm not sure if this and networkx is the best way to do it or if there is a tool (e.g. bokeh or plotly) that is designed for this type of plotting.


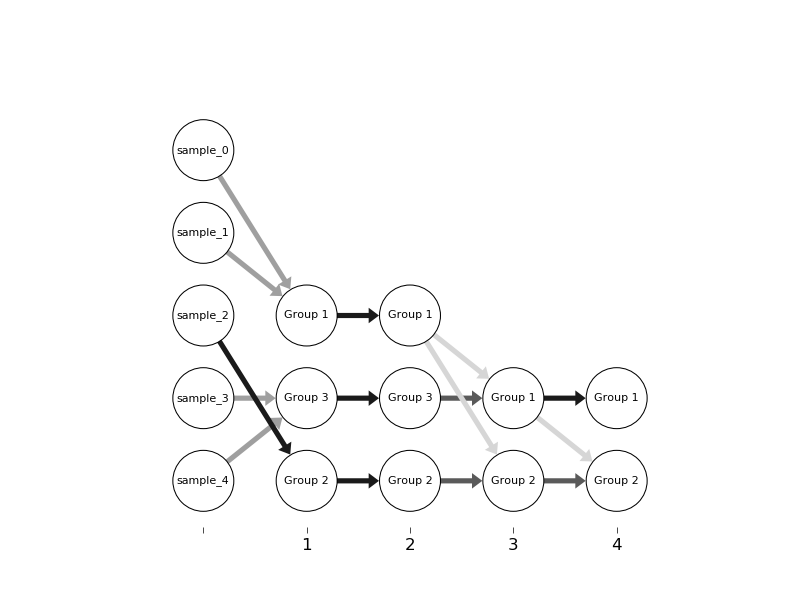
prog='dot'is crucial, but may well get you where you want to go. Note you need to install graphviz andpygraphvizin addition tonetworkxandmatplotlib. – Nebulous