I'm trying to draw some DAGs using networkx 1.11 but I'm facing some errors, here's the test:
import networkx as nx

print nx.__version__

G = nx.DiGraph()
G.add_node(1,level=1)
G.add_node(2,level=2)
G.add_node(3,level=2)
G.add_node(4,level=3)

G.add_edge(1,2)
G.add_edge(1,3)
G.add_edge(2,4)

import pylab as plt
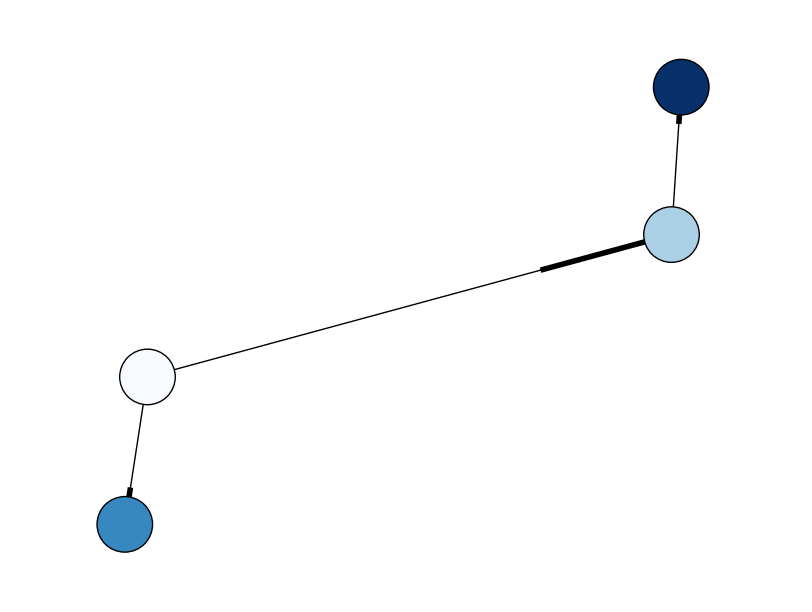
nx.draw_graphviz(G, node_size=1600, cmap=plt.cm.Blues,
                 node_color=range(len(G)),
                 prog='dot')
plt.show()
And here's the traceback:
Traceback (most recent call last):
  File "D:\sources\personal\python\framework\stackoverflow\test_dfs.py", line 69, in <module>
    prog='dot')
  File "d:\virtual_envs\py2711\lib\site-packages\networkx\drawing\nx_pylab.py", line 984, in draw_graphviz
    pos = nx.drawing.graphviz_layout(G, prog)
AttributeError: 'module' object has no attribute 'graphviz_layout'
I'm using python 2.7.11 x64, networkx 1.11 and I've installed graphviz-2.38 having dot available in PATH. What am I missing?
Once it works, how could i draw the graph with nodes which:
- Use white background color
- Have labels inside
- Have directed arrows
- Are arranged nicely either automatically or manually
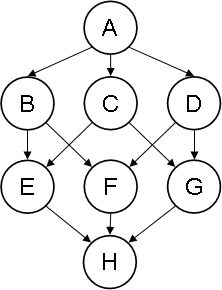
Something similar to the below image
As you can see in that image, nodes are aligned really nicely


nx.graphviz_layoutornx.drawing.nx_agraph.graphviz_layout. – Hairynx.graphviz_layoutI'll getAttributeError: 'module' object has no attribute 'graphviz_layout'but usingnx.drawing.nx_agraph.graphviz_layoutkinda works. Although neithernx.graphviz_layout(G, prog='dot') nor nx.drawing.nx_agraph.graphviz_layout(G)are showing anything. If you could provide a mcve example of this I could validate your answer, thanks! – Birch