I want to generate random numbers according some distributions. How can I do this?
The standard random number generator you've got (rand() in C after a simple transformation, equivalents in many languages) is a fairly good approximation to a uniform distribution over the range [0,1]. If that's what you need, you're done. It's also trivial to convert that to a random number generated over a somewhat larger integer range.
Conversion of a Uniform distribution to a Normal distribution has already been covered on SO, as has going to the Exponential distribution.
[EDIT]: For the triangular distribution, converting a uniform variable is relatively simple (in something C-like):
double triangular(double a,double b,double c) {
   double U = rand() / (double) RAND_MAX;
   double F = (c - a) / (b - a);
   if (U <= F)
      return a + sqrt(U * (b - a) * (c - a));
   else
      return b - sqrt((1 - U) * (b - a) * (b - c));
}
That's just converting the formula given on the Wikipedia page. If you want others, that's the place to start looking; in general, you use the uniform variable to pick a point on the vertical axis of the cumulative density function of the distribution you want (assuming it's continuous), and invert the CDF to get the random value with the desired distribution.
U = ((double)rand()) / RAND_MAX. Otherwise, your sqrt((1 - U) ...) is going to come out imaginary. –
Pietrek The right way to do this is to decompose the distribution into n-1 binary distributions. That is if you have a distribution like this:
A: 0.05
B: 0.10
C: 0.10
D: 0.20
E: 0.55
You transform it into 4 binary distributions:
1. A/E: 0.20/0.80
2. B/E: 0.40/0.60
3. C/E: 0.40/0.60
4. D/E: 0.80/0.20
Select uniformly from the n-1 distributions, and then select the first or second symbol based on the probability if each in the binary distribution.
It actually depends on distribution. The most general way is the following. Let P(X) be the probability that random number generated according to your distribution is less than X.
You start with generating uniform random X between zero and one. After that you find Y such that P(Y) = X and output Y. You could find such Y using binary search (since P(X) is an increasing function of X).
This is not very efficient, but works for distributions where P(X) could be efficiently computed.
You can look up inverse transform sampling, rejection sampling as well as the book by Devroye "Nonuniform random variate generation"/Springer Verlag 1986
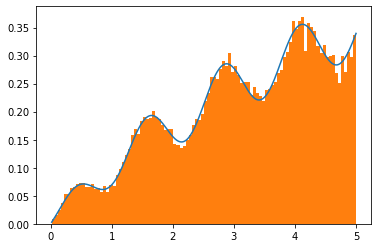
In the past few years, nice new tools have been added to SciPy to address this kind of problem in Python. You can easily generate samples from custom continuous or discrete univariate distributions by just providing some information about the distribution, such as the density / pdf.
Overview of the different methods: https://docs.scipy.org/doc/scipy/reference/stats.sampling.html
Tutorial: https://docs.scipy.org/doc/scipy/tutorial/stats/sampling.html
If you are using R, very similar functionality is available in Runuran (https://CRAN.R-project.org/package=Runuran).
C library UNURAN: https://statmath.wu.ac.at/unuran/doc.html
Here is an example in Python:
import numpy as np
from scipy.stats.sampling import NumericalInversePolynomial
from matplotlib import pyplot as plt
from scipy.integrate import quad


class MyDist:
    def __init__(self, a):
        self.a = a

    def support(self):
        # distribution restricted to 0, 5, can be changed as needed
        return (0, 5)

    def pdf(self, x):
        # this is not a proper pdf, the normalizing
        # constant is missing (does not integrate to one)
        return x * (x + np.sin(5*x) + 2) * np.exp(-x**self.a)


dist = MyDist(0.5)
gen = NumericalInversePolynomial(dist)

# compute the missing normalizing constant to plot the pdf
const_pdf = quad(dist.pdf, *dist.support())[0]

r = gen.rvs(size=50000)
x = np.linspace(r.min(), r.max(), 500)

# show histogram together with the pdf
plt.plot(x, dist.pdf(x) / const_pdf)
plt.hist(r, density=True, bins=100)
plt.show()
You can convert from discrete bins to float/double with interpolation. Simple linear works well. If your table memory is constrained other interpolation methods can be used. -jlp
© 2022 - 2024 — McMap. All rights reserved.

