How to save MATLAB figure as JPEG using saveas() without the image coming off badly?
Asked Answered
A

3

23

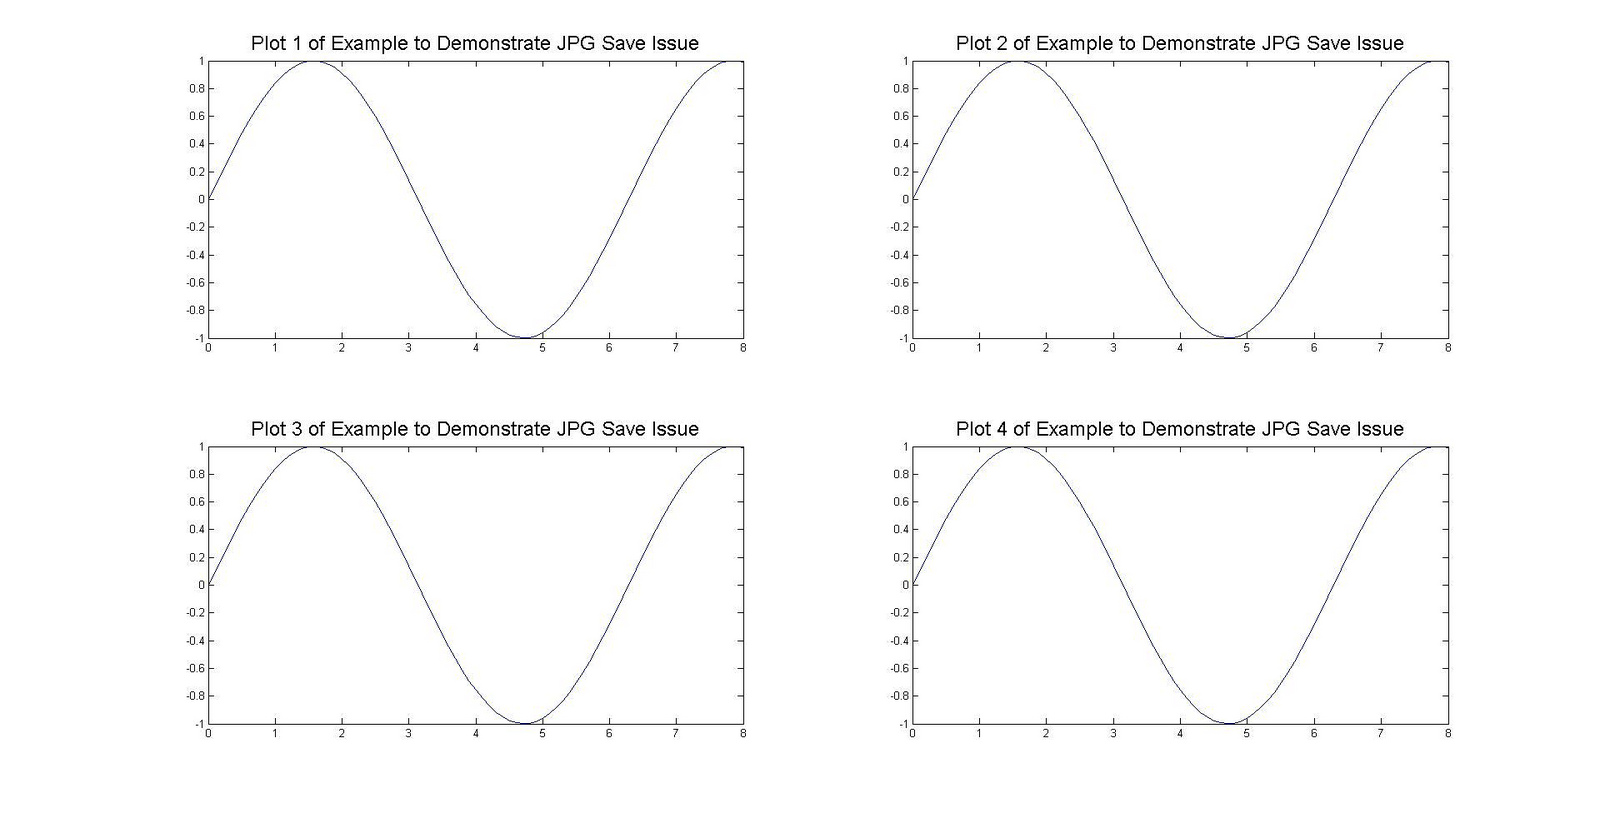
In a MATLAB function I am writing, I am generating a figure. The figure is displayed when the function is executed. I need to save the figure as a JPEG image. To do that, I could do File->Save As in the figure window that displays the figure. But I'd like to automate this. I've tried to do that using the saveas() function. The problem is that the resulting image is undesirable. Here are the images for a demo problem to show you what I mean:

JPEG image saved manually using File->Save As in the MATLAB figure window: manual file save as jpg rendering
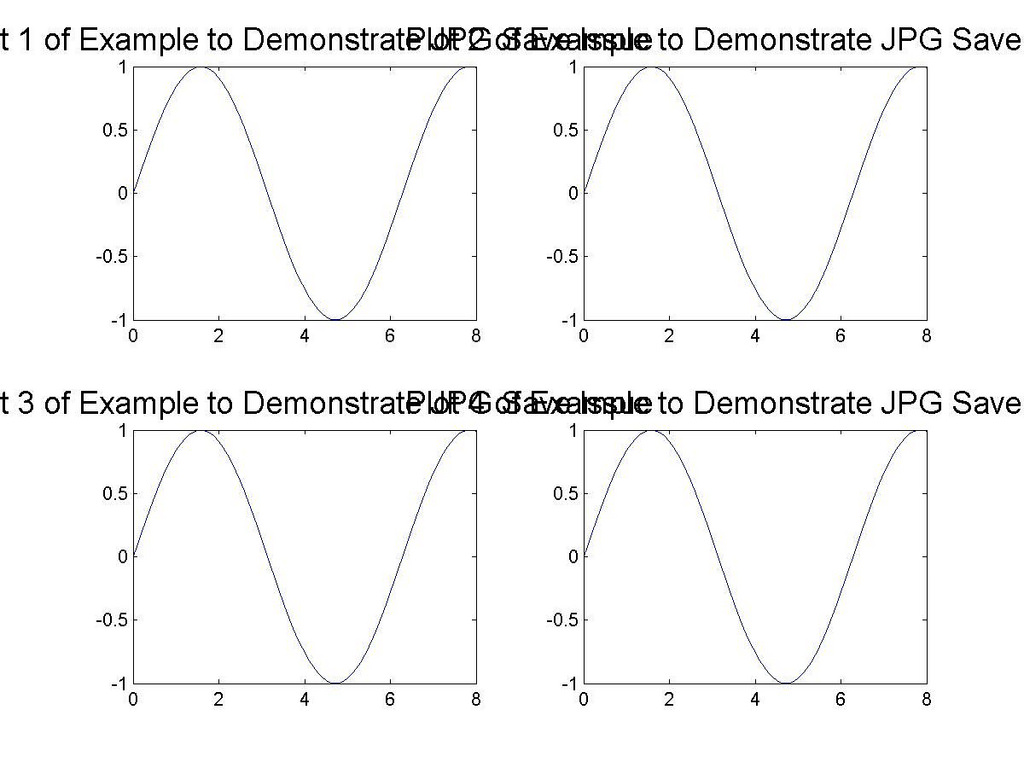
JPEG Image saved using saveas() function (notice that the plots aren't as nice and the titles overlap): saveas jpg rendering
Here is the MATLAB function in which I generate the figure and save the figure as a JPEG using saveas():

function JpgSaveIssueDemo( )
    figure( 1 );
    t = 0:0.1:8;    

    subplot( 2, 2, 1 );    
    plot( t, sin(t) );
    title( 'Plot 1 of Example to Demonstrate JPG Save Issue', 'FontSize', 18 );

    subplot( 2, 2, 2 );
    plot( t, sin(t) );
    title( 'Plot 2 of Example to Demonstrate JPG Save Issue', 'FontSize', 18 );

    subplot( 2, 2, 3 );
    plot( t, sin(t) );
    title( 'Plot 3 of Example to Demonstrate JPG Save Issue', 'FontSize', 18 );

    subplot( 2, 2, 4 );
    plot( t, sin(t) );
    title( 'Plot 4 of Example to Demonstrate JPG Save Issue', 'FontSize', 18 );

    saveas( gcf, 'DemoPlot', 'jpg' );
end

The figure that is displayed when JpgSaveIssueDemo() is executed isn't maximized. So, I thought that if I could maximize it using function call/s in JpgSaveIssueDemo() before saveas() is executed, then the JPEG image saved would come out well.

So, I used this code before the saveas() line in JpgSaveIssueDemo() to maximize the figure:

drawnow;
jFrame = get(handle(gcf),'JavaFrame'); 
jFrame.setMaximized(true);

Then, the figure that is displayed is maximized. However, the result is the same: the JPEG image still comes out undesirably.

What can be done for this?

Allodial answered 13/4, 2013 at 5:32 Comment(1)
Partial Solution: Jpg is the wrong type of image for this. The squares of garbage, near the line in your image, are jpg compression artifacts. Use jpg for things like photographs, use png for things like graphs. The png format will give you better quality and smaller file size.Colossae
H
20

The Matlab figure export dialog and the saveas() function lack a lot of desirable functionality. Especially, savas() cannot create a custom resoultion image which is why your results look poor. For creation of bitmap images I highly recommend using the third-party function export_fig. By adding the following code to your function (including the maximizing trick)

set(gcf, 'Color', 'white'); % white bckgr
export_fig( gcf, ...      % figure handle
    'Export_fig_demo',... % name of output file without extension
    '-painters', ...      % renderer
    '-jpg', ...           % file format
    '-r72' );             % resolution in dpi

I created this image: (use "show image" or similar in your browser to get the original size)

image created with export_fig

For higher quality use higher resolutions of 150 or even 300 dpi (for print). Instead of maximizing the figure window, for most applications it's suitable to define the axis size to obtain an image of the desired size:

unitSave = get(figureHandle, 'Unit');                % store original unit
set(figureHandle, 'Unit', 'centimeters');            % set unit to cm
set(figureHandle,'position',[0 0 width height]);     % set size
set(figureHandle, 'Unit', unitSave);                 % restore original unit
Hypotonic answered 13/4, 2013 at 9:3 Comment(1)
A great answer which seems to solve my problem as well: https://mcmap.net/q/586069/-ghostscript-error-with-print-function-in-matlab/376454Clio
T
4

Just use a lossless scalable format like EPS, see last line in the snippet below :)

h1=figure % create figure
plot(t,Data,'r');
legend('Myfunction');

% Create title with required font size
title({'Variance vs distance'},'LineWidth',4,'FontSize',18,...
'FontName','Droid Sans');

% Create xlabel with required font size
xlabel({'Distance (cm)'},'FontSize',14,...
'FontName','DejaVu Sans');

% Create ylabel with required font size
ylabel({'Variance of sobel gradients'},'FontSize',14,...
'FontName','DejaVu Sans');

print(h1,'-depsc','autofocus.eps') % print figure to a file

I cannot attach an EPS file here though, not supported, but its scalable and can be put in word processors or Latex without worrying about bad resolution.

Tarmac answered 21/11, 2014 at 9:27 Comment(0)
C
1

I had the same problem, and here is what I used to solve it:

set(gcf,'PaperPositionMode','auto') saveas(gcf,'file_to_save','png')

where gcf can be replaced by the handle to the desired figure.

Cohdwell answered 21/11, 2016 at 22:51 Comment(0)

© 2022 - 2024 — McMap. All rights reserved.