Ordering coordinates from top left to bottom right
Asked Answered
A

3

21

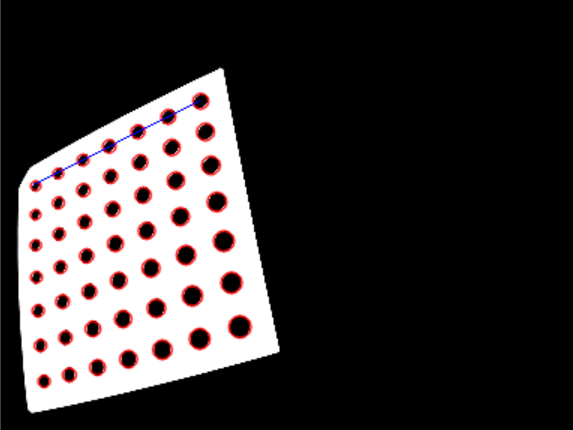
How can I go about trying to order the points of an irregular array from top left to bottom right, such as in the image below?

Points ordered top left to bottom right

Methods I've considered are:

  • calculate the distance of each point from the top left of the image (Pythagoras's theorem) but apply some kind of weighting to the Y coordinate in an attempt to prioritise points on the same 'row' e.g. distance = SQRT((x * x) + (weighting * (y * y)))

  • sort the points into logical rows, then sort each row.

Part of the difficulty is that I do not know how many rows and columns will be present in the image coupled with the irregularity of the array of points. Any advice would be greatly appreciated.

Archducal answered 14/4, 2015 at 14:29 Comment(6)
Maybe try and express in English what the rule is for deciding if a point belongs in one row or the next. Does the size of the circles have any significance for example? Try drawing the bigger or smaller and see if that influences your decisions. Is the rule related to whether there is a clear, unobstructed horizontal line that can be drawn below points without encroaching on the next line?Bootstrap
@MarkSetchell Thanks for the ideas, you've definitely given me some food for thought.Archducal
Do you assume that the number of points is same for all lines?Drandell
Related Q&A: https://mcmap.net/q/538855/-how-can-i-sort-contours-from-left-to-right-and-top-to-bottom-duplicateDariusdarjeeling
can someone add a Python and Numpy tag to the question? I was trying to look for this, its a good example ! thanksUpkeep
related posts #56150730 #38805962Upkeep
T
22

Even though the question is a bit older, I recently had a similar problem when calibrating a camera.

The algorithm is quite simple and based on this paper:

  • Find the top left point: min(x+y)
  • Find the top right point: max(x-y)
  • Create a straight line from the points.
  • Calculate the distance of all points to the line
    • If it is smaller than the radius of the circle (or a threshold): point is in the top line.
    • Otherwise: point is in the rest of the block.
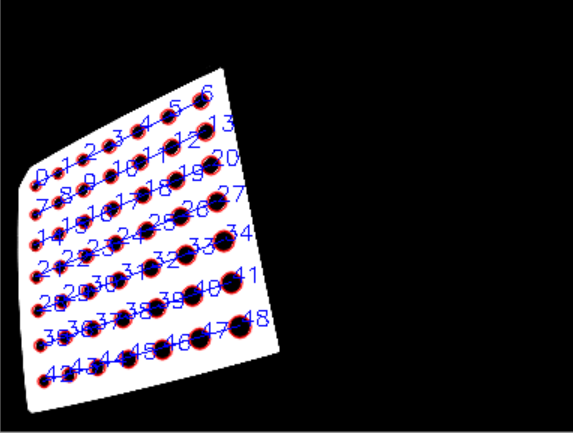
  • Sort points of the top line by x value and save.
  • Repeat until there are no points left.

My python implementation looks like this:

#detect the keypoints
detector = cv2.SimpleBlobDetector_create(params)
keypoints = detector.detect(img)
img_with_keypoints = cv2.drawKeypoints(img, keypoints, np.array([]), (0, 0, 255), 
cv2.DRAW_MATCHES_FLAGS_DRAW_RICH_KEYPOINTS)

points = []
keypoints_to_search = keypoints[:]
while len(keypoints_to_search) > 0:
    a = sorted(keypoints_to_search, key=lambda p: (p.pt[0]) + (p.pt[1]))[0]  # find upper left point
    b = sorted(keypoints_to_search, key=lambda p: (p.pt[0]) - (p.pt[1]))[-1]  # find upper right point

    cv2.line(img_with_keypoints, (int(a.pt[0]), int(a.pt[1])), (int(b.pt[0]), int(b.pt[1])), (255, 0, 0), 1)

    # convert opencv keypoint to numpy 3d point
    a = np.array([a.pt[0], a.pt[1], 0])
    b = np.array([b.pt[0], b.pt[1], 0])

    row_points = []
    remaining_points = []
    for k in keypoints_to_search:
        p = np.array([k.pt[0], k.pt[1], 0])
        d = k.size  # diameter of the keypoint (might be a theshold)
        dist = np.linalg.norm(np.cross(np.subtract(p, a), np.subtract(b, a))) / np.linalg.norm(b)   # distance between keypoint and line a->b
        if d/2 > dist:
            row_points.append(k)
        else:
            remaining_points.append(k)

    points.extend(sorted(row_points, key=lambda h: h.pt[0]))
    keypoints_to_search = remaining_points

Uppermost line Numerated points

Triturate answered 3/11, 2020 at 8:56 Comment(5)
I am getting the following error, ValueError: The truth value of an array with more than one element is ambiguous. Use a.any() or a.all() on this line, a = sorted(keypoints_to_search, key=lambda p: (p.pt[0]) any idea how to resolve it?Upkeep
I assume the + (p.pt[1]))[0] is not missing in that line. It should work for any list of objects where the object contains a "pt" member that is a list of at leats two numbers as keypoints_to_search. I think there is your problem. Otherwise maybe write the sorting in another way yourself (a has to be the point with the minimal sum of the points x and y values and b has to be the point with the maximal difference between x and y). Are you using the opencv keypoints?Triturate
ok I posted question here, currently using contours instead of keypoints #66947304Upkeep
Very useful answer, thanks. Curious, why do you have to convert the keypoints to numpy 3d points?Deadradeadweight
I needed them as numpy 3d points later on, so i did it there and was able use the np based functions like cross, subtract or norm, but you dont have to do that and could use other datatypes/structuresTriturate
R
3

Jumping on this old thread because I just dealt with the same thing: sorting a sloppily aligned grid of placed objects by left-to-right, top to bottom location. The drawing at the top in the original post sums it up perfectly, except that this solution supports rows with varying numbers of nodes.

S. Vogt's script above was super helpful (and the script below is entirely based on his/hers), but my conditions are narrower. Vogt's solution accommodates a grid that may be tilted from the horizontal axis. I assume no tilting, so I don't need to compare distances from a potentially tilted top line, but rather from a single point's y value.

Javascript below:

interface Node {x: number; y: number; width:number; height:number;}
const sortedNodes = (nodeArray:Node[]) => {
    let sortedNodes:Node[] = []; // this is the return value
    let availableNodes = [...nodeArray]; // make copy of input array
    while(availableNodes.length > 0){
        // find y value of topmost node in availableNodes. (Change this to a reduce if you want.)
        let minY = Number.MAX_SAFE_INTEGER;
        for (const node of availableNodes){
            minY = Math.min(minY, node.y)
        }
        // find nodes in top row: assume a node is in the top row when its distance from minY 
        // is less than its height
        const topRow:Node[] = [];
        const otherRows:Node[] = [];
        for (const node of availableNodes){
            if (Math.abs(minY - node.y) <= node.height){
                topRow.push(node);
            } else {
                otherRows.push(node);
            }
        }
        topRow.sort((a,b) => a.x - b.x); // we have the top row: sort it by x
        sortedNodes = [...sortedNodes,...topRow] // append nodes in row to sorted nodes
        availableNodes = [...otherRows] // update available nodes to exclude handled rows
    }
    return sortedNodes;
};

The above assumes that all node heights are the same. If you have some nodes that are much taller than others, get the value of the minimum node height of all nodes and use it instead of the iterated "node.height" value. I.e., you would change this line of the script above to use the minimum height of all nodes rather that the iterated one.

if (Math.abs(minY - node.y) <= node.height)
Rwanda answered 7/4, 2021 at 3:10 Comment(0)
W
0

I propose the following idea:
1. count the points (p)
2. for each point, round it's x and y coordinates down to some number, like
x = int(x/n)*n, y = int(y/m)*m for some n,m 3. If m,n are too big, the number of counts will drop. Determine m, n iteratively so that the number of points p will just be preserved.

Starting values could be in alignment with max(x) - min(x). For searching employ a binary search. X and Y scaling would be independent of each other.

In natural words this would pin the individual points to grid points by stretching or shrinking the grid distances, until all points have at most one common coordinate (X or Y) but no 2 points overlap. You could call that classifying as well.

Weir answered 14/4, 2015 at 15:2 Comment(0)

© 2022 - 2024 — McMap. All rights reserved.