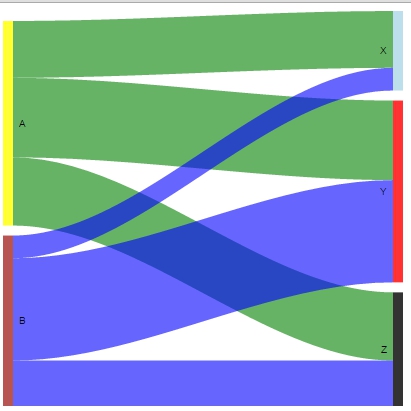
As soon as you have to color links from 2 originated nodes you'll need 2 colors for links.
Also you have 5 nodes in total, so you'll need 5 colors for them.
Lets create 2 arrays in JSON format with colors for nodes and links
colors_link <- c('green', 'blue')
colors_link_array <- paste0("[", paste0("'", colors_link,"'", collapse = ','), "]")

colors_node <- c('yellow', 'lightblue', 'red', 'black', 'brown')
colors_node_array <- paste0("[", paste0("'", colors_node,"'", collapse = ','), "]")
Next, insert that array into options:
opts <- paste0("{
        link: { colorMode: 'source',
                colors: ", colors_link_array ," },
        node: { colors: ", colors_node_array ," }
      }" )
And, finally plot graph:
plot( gvisSankey(datSK, from="From", to="To", weight="Weight",
                     options=list(
                       sankey=opts)))
![enter image description here]()
Note, that in options colorMode is set to 'source' which means you would like to color links from originated nodes. Alternatively, set 'target' to color links for destinated nodes
EDIT: add description for multilevel sankeys
It is a bit tricky to find how to assign colors for multilevel sankeys.
We need to create other dateframe:
datSK <- data.frame(From=c(rep("A",3), rep("B", 3), rep(c("X", "Y", "Z"), 2 )),
                To=c(rep(c("X", "Y", "Z"),2), rep("M", 3), rep("N", 3)),
                Weight=c(5,7,6,2,9,4,3,4,5,6, 4,8))
Here we have to change only arrays of colors. Command to built plot is the same
Let's assume we want these colors for the nodes and links :
colors_link <- c('green', 'blue', 'yellow', 'brown', 'red')
colors_link_array <- paste0("[", paste0("'", colors_link,"'", collapse = ','), "]")

colors_node <- c('yellow', 'lightblue', 'red', 'black', 'brown', 'green', 'brown')
colors_node_array <- paste0("[", paste0("'", colors_node,"'", collapse = ','), "]")
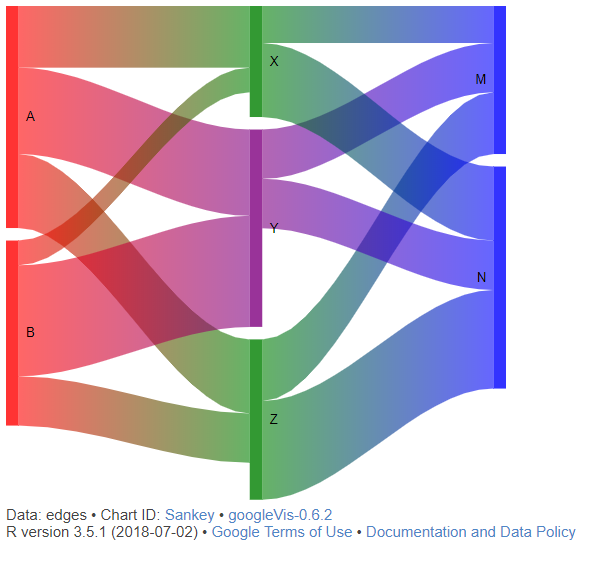
Result would be :
![enter image description here]()
The most trickiest part is to understand how these colors are assigned:
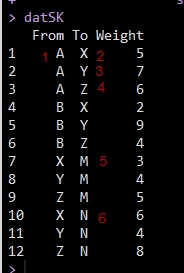
- Links are assigned in the order they appear in dataset (row_wise)
![enter image description here]()
For the nodes colors are assigned in the order plot is built.
- From A to X, Y, Z - green
- From X to M, N - blue
- From Y to M, N - yellow
- From Z to M, N - brown
- From B to X, Y, Z - red
More detailed information on how to format sankey diagram : https://developers.google.com/chart/interactive/docs/gallery/sankey


