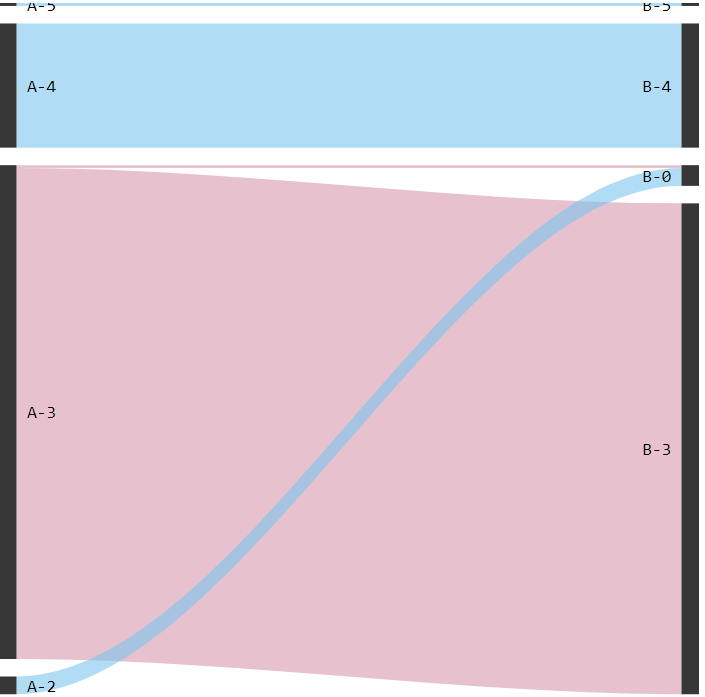
I am creating a Sankey diagram using googleVis in R.
I want to to color links of nodes that "advance" in one color, links of nodes that "regress" in another, and links of nodes that "stay the same" in a third color. For example:
A1 -> B3 means moving up,
A1 -> B0 means moving down, and
A1 -> B1 means staying the same
I looked at this post How to change node and link colors in R googleVis sankey chart but my case is a bit different in that two links coming out of the same node (when using source) should end up taking on different colors.
Does anybody know how to do that? Here is my current code. It creates a Sankey, coloring the links based on their source:
df <- structure(list(source = c("A-5", "A-4", "A-3", "A-3","A-2"),
                     target = c("B-5", "B-4", "B-0", "B-3","B-0"),
                     value = c(3L, 21L, 3L, 80L, 11L)),
                     .Names = c("source","target", "value"),
                     row.names = c(1L, 2L, 3L, 4L, 5L),
                     class = "data.frame")
colors_node_array <- paste0("[",paste0(rep("'#050505'",8), collapse =","),"],")

opts <- paste0("{
               iterations: 0,
               link: { colorMode: 'source',
               colors: ['#7cc5ef','#7cc5ef','#d799ae','#7cc5ef'] },
               node: { colors: ", colors_node_array , "
               label: { fontName: 'consolas',
               fontSize: 10,
               color: '#000000',
               bold: false,
               italic: false }}
               }")

plot(gvisSankey(df,
                from = "source", to = "target", weight = "value",
                options = list(sankey = opts)
    )
)

