plotting a curve around a set of points
Asked Answered
D

4

28

I have a set of points on a plane. They are partitioned into subsets. I want to plot a closed curve around points that belong to the same subset, so that points that belong to a subset will be inside the curve, and those that aren't will be outside. Therefore simple circles, or a convex hull might not work.

For a starter, let's say I just want to have a smooth curve around a set of point (without the requirement that it excludes other points)

Any ideas how to do that in R?

---added later---

What I'm looking eventually, is something in the spirit of the graphics in here: https://tex.stackexchange.com/questions/1175/drawing-a-hypergraph - although the context is not a hypergraph, but rather a given set of points and a partition of those.

Degradable answered 27/11, 2012 at 5:28 Comment(7)
When you say smooth curve- do you mean that a convex hull wouldn't work (for the starter problem you're talking about)?Plumcot
for aesthetic reasons I prefer a smoother curve than the convex hull polygon. Of course, for the starter question an easy solution would be to find a big enough circle that contains all the points. But this solution cannot be applied/extended to the general question. I try to find something that enclose the points more snugly to the given set of points.Degradable
@Degradable - Could you use bezier from the Hmisc library to smooth out the chull polygon?Carillo
@thelatemail: I'm not sure that would guarantee that all points from the polygon would be inside the curve, though I could be wrongPlumcot
I am not sure, but problem can be formulated as a KNN problem with countour plotPointed
@DavidRobinson - true. I tested it and it didn't work as I intended.Carillo
Quick thought until I get a chance to try it - a contour from a kernel smoothing of your point density might work... But you need careful parameter choices to prevent splitting it into two regions (is that bad in your case?) or just ending up with a big circle...Footton
C
22

Okay, here's a version of an answer that I think gets close to what you are chasing: It uses the spline.poly function created over at this answer ( https://gis.stackexchange.com/a/24929 ) on the GIS forum.

Here's some example points:

testpts <- 
structure(list(x = c(4.9, 4.2, 4, 4.1, 4.4, 5.8, 5.8, 5.8, 5.8, 
5.5, 4.9, 3.2, 3.2, 3.3, 5.4, 5.4, 5.7, 6.4, 6.7, 6.7, 6, 4.8, 
3.6, 2.8, 3.5, 4.4, 5.1, 4, 3.7, 4.5, 4.9, 5.7), y = c(6.9, 6.2, 
5.3, 4.1, 3.1, 2.9, 2.9, 3.5, 4.2, 4.9, 5.1, 4.9, 4.9, 5.2, 6.9, 
6.9, 5.3, 3.8, 4.2, 5.6, 6.9, 5.8, 1.2, 2.5, 5.3, 6.4, 6.8, 7.6, 
6.9, 5.4, 4.8, 4.4)), .Names = c("x", "y"))

Set up a basic plot

plot(NA,xlim=c(0,10),ylim=c(0,10))
points(testpts,pch=19)
chuld <- lapply(testpts,"[",chull(testpts))
polygon(chuld,lty=2,border="gray")
polygon(spline.poly(as.matrix(as.data.frame(chuld)),100),border="red",lwd=2)

And the result:

chullin' it up!

EDIT TO ADD A CONCAVE EXAMPLE

This part of the answer uses the alphahull library

# load the required library
library(alphahull)

plot(NA,xlim=c(0,10),ylim=c(0,10))
points(testpts,pch=19)
# remove duplicate points so the ahull function doesn't error out
testptsnodup <- lapply(testpts,"[",which(!duplicated(as.matrix(as.data.frame(testpts)))))

Generate and plot the ahull object - the alpha value seems to be very important in determining the fit of the polygon to the data.

ahull.obj <- ahull(testptsnodup,alpha=2)
plot(ahull.obj,add=TRUE,col="red",wpoints=FALSE)

And the result:

enter image description here

Carillo answered 27/11, 2012 at 8:20 Comment(4)
This is a nice solution! I think the curve is still rather "big", because it is based on the convex hull, and therefore it will be difficult to "exclude" points that do not belong to the set. but the spline.poly can be used for concave polygons as well. I just need to compute that polygon. Thanks.Degradable
@Degradable - This package might be of interest to you: cran.r-project.org/web/packages/alphahull/index.html which I found linked at this question on the GIS stackexchange again: gis.stackexchange.com/questions/1200/…Carillo
@Degradable - I have incorporated a new example showing a concave solution. Let me know if it looks like what you want or not.Carillo
There's a function rgeos::gBuffer that can "grow" a polygon by a certain amount. This could help OP get close to question in the link provided.Painty
A
9

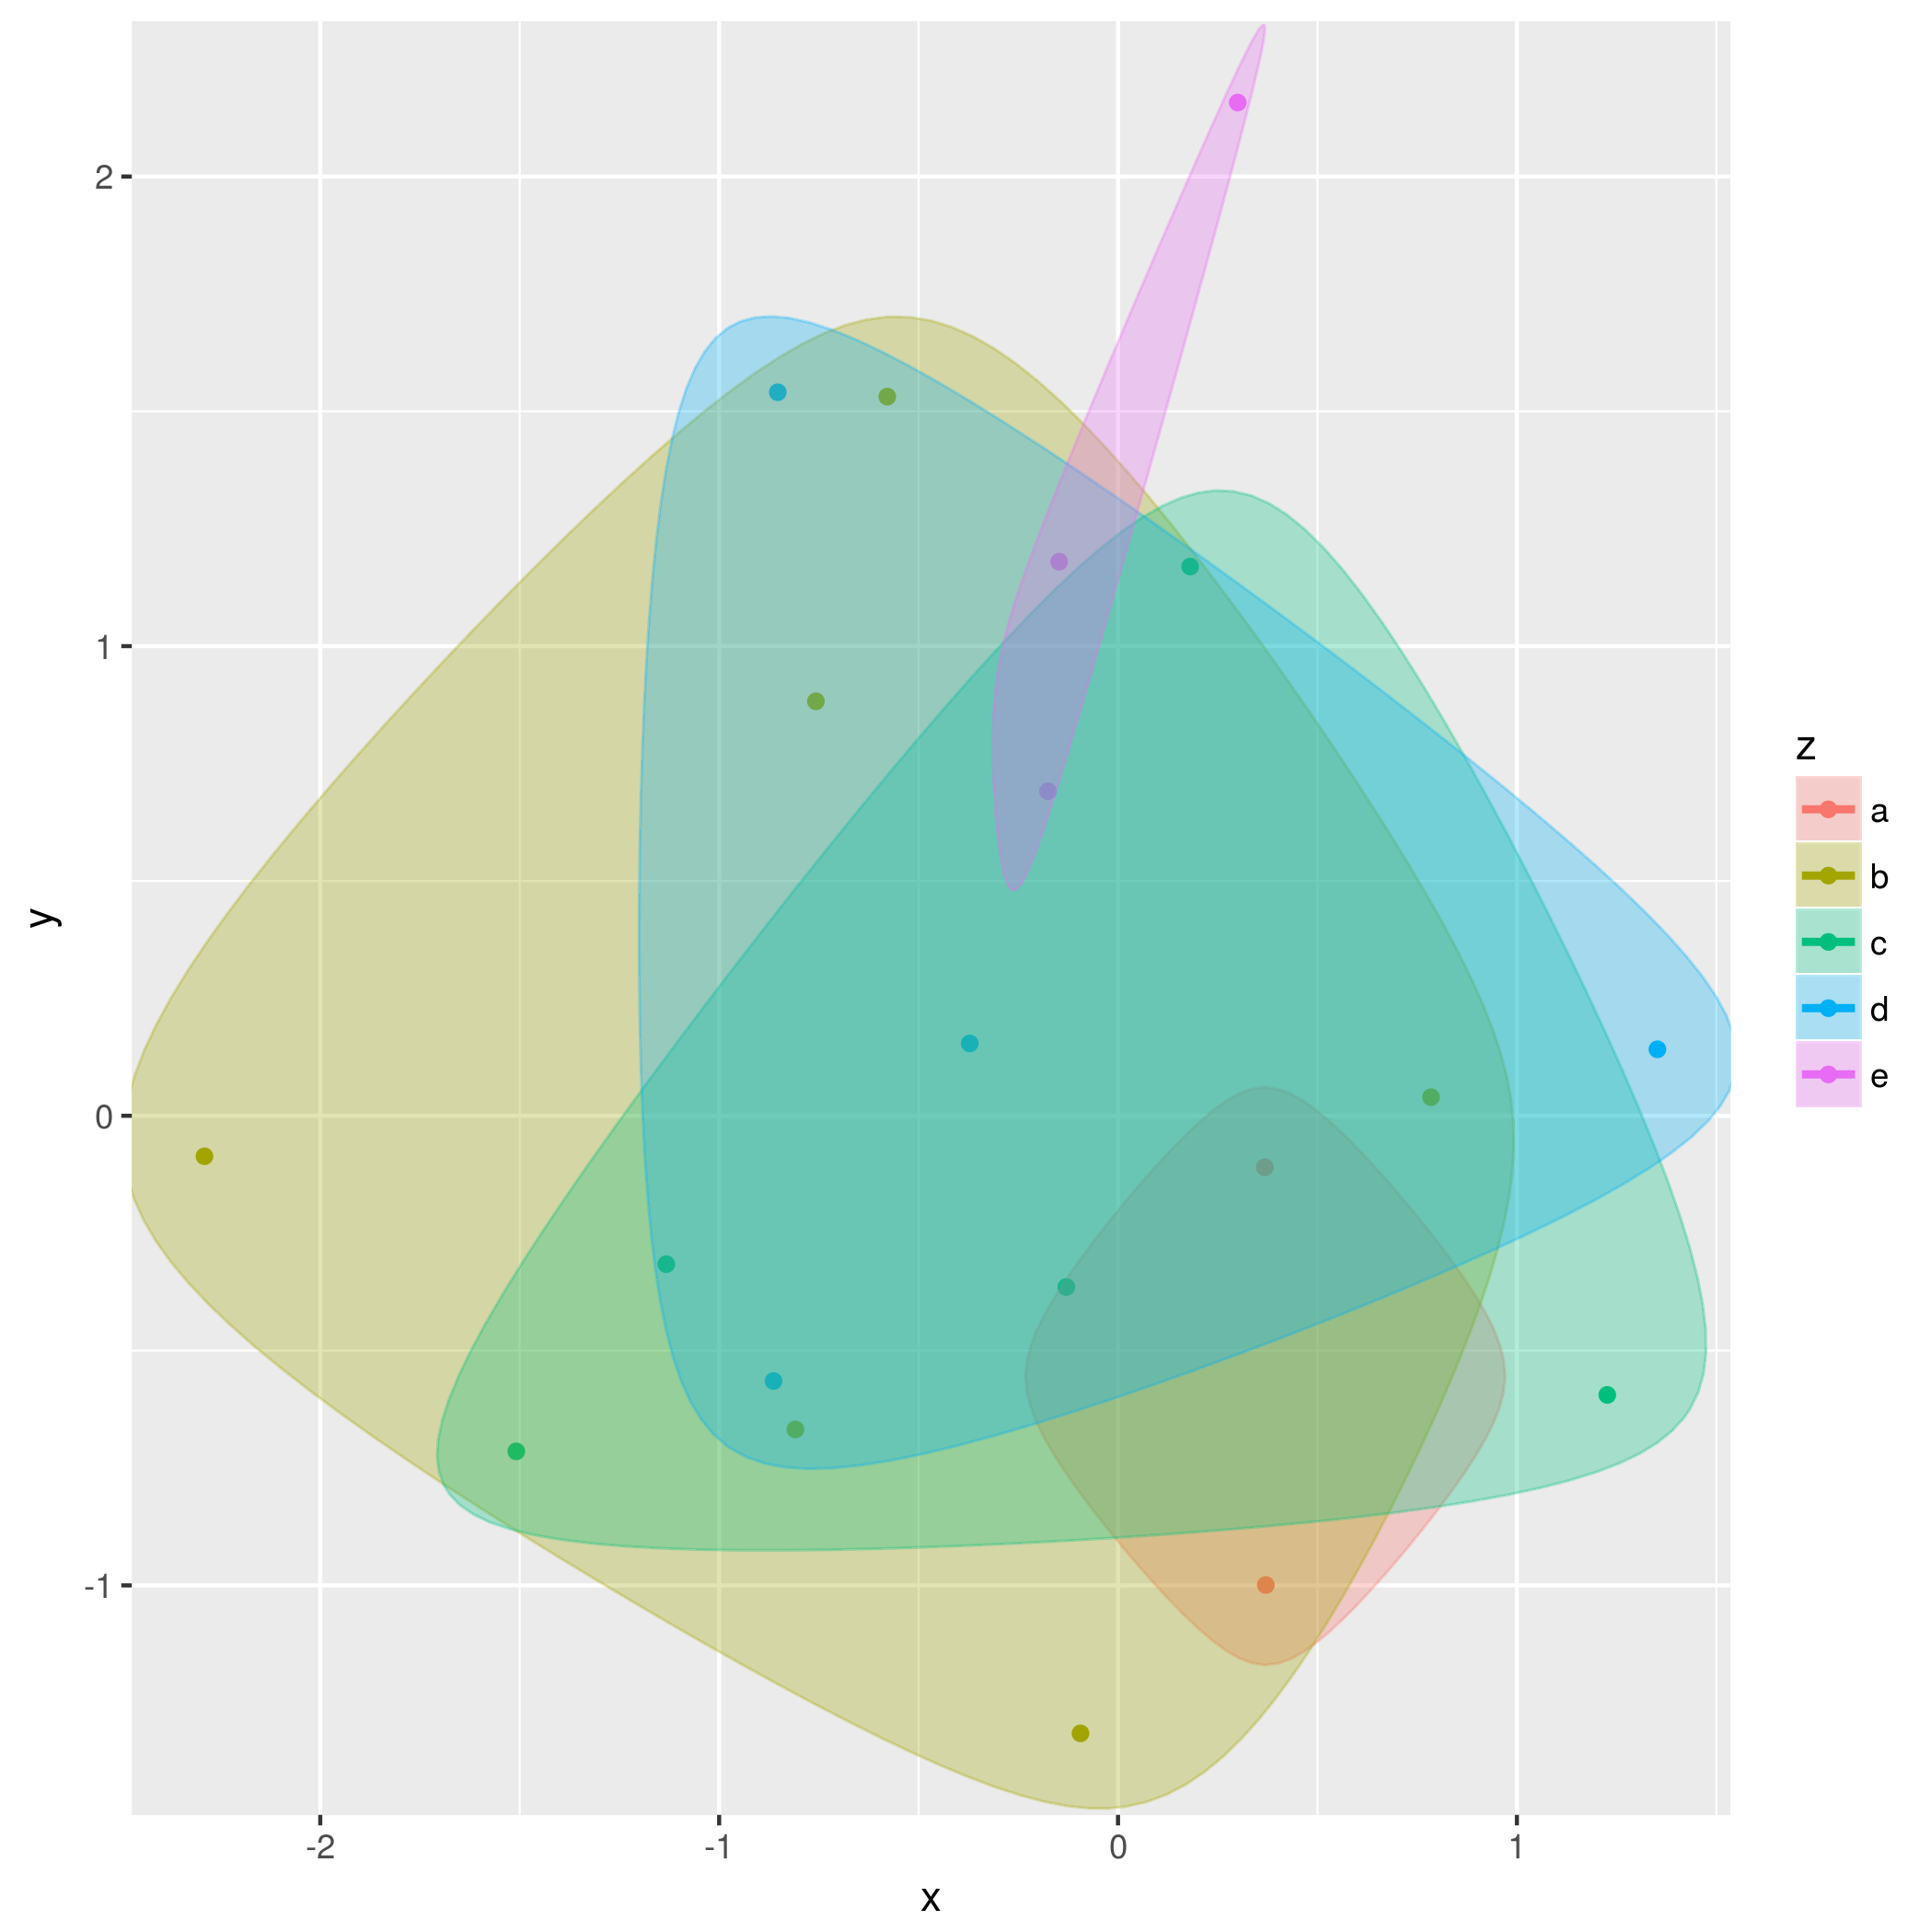
The ggalt package provides geom_encircle, which is supposed to provide something like this - convex, but smooth:

library(ggplot2)
library(ggalt)  ## v 0.4.0

df <- data.frame(x = rnorm(20), y = rnorm(20),
      z = sample(letters[1:5], 20, replace = TRUE))
ggplot(df, aes(x, y, colour = z)) + geom_point() +
     geom_encircle(aes(fill=z),alpha=0.3)

enter image description here

Animadversion answered 9/12, 2016 at 3:36 Comment(0)
P
3

After some googling, I little modify this example Morota ggplot2

EDIT

It uses the chull function with bezier

library(ggplot2)
library(plyr)
library(Hmisc)


df <- data.frame(x = rnorm(20), y = rnorm(20),z = sample(letters[1:5], 20, rep = T))
ggplot(df, aes(x, y, colour = z)) + geom_point()

find_hull <- function(df) {
    res.ch <- df[chull(df$x, df$y), ]
    res <- bezier(res.ch)
    res <- data.frame(x=res$x,y=res$y)
    res$z <- res$z
    res
  }
hulls <- ddply(df, "z", find_hull)
ggplot(df, aes(x, y, colour = z,fill = z)) +
  geom_point() + geom_polygon(data = hulls,alpha = 0.4)

enter image description here

Pointed answered 27/11, 2012 at 6:36 Comment(4)
This wouldn't be smooth as the OP requested, thoughPlumcot
@David It is more smoother now.Pointed
I think your original answer was better. While smoother, this result seems to miss a number of the points.Carillo
I think it is due also to the fact I generate randomly my data..I replace spline.poly by bezier in your code, and I have nearly your result. I am not staisfied by my 2 solutions...I try later to formulate it as a Nearset Neighbor problem.Pointed
L
0

Simply:

testpts <- structure(list(x = c(4.9, 4.2, 4, 4.1, 4.4, 5.8, 5.8, 5.8, 5.8, 
5.5, 4.9, 3.2, 3.2, 3.3, 5.4, 5.4, 5.7, 6.4, 6.7, 6.7, 6, 4.8, 
3.6, 2.8, 3.5, 4.4, 5.1, 4, 3.7, 4.5, 4.9, 5.7), y = c(6.9, 6.2, 
5.3, 4.1, 3.1, 2.9, 2.9, 3.5, 4.2, 4.9, 5.1, 4.9, 4.9, 5.2, 6.9, 
6.9, 5.3, 3.8, 4.2, 5.6, 6.9, 5.8, 1.2, 2.5, 5.3, 6.4, 6.8, 7.6, 
6.9, 5.4, 4.8, 4.4)), .Names = c("x", "y"))
x <- do.call('cbind',testpts)
ch<-chull(x)
x[c(ch,ch[1]),]
plot(x,pch=20)
points(x[ch,],pch=20,col='red')
lines(x[c(ch,ch[1]),],lwd=.5)

Plot:

the plot

Lydell answered 23/1, 2014 at 21:53 Comment(1)
The OP does not want a chull: "Therefore [...] a convex hull might not work."Fluvial

© 2022 - 2024 — McMap. All rights reserved.