Consider the following simple code:
#include <stdlib.h>
#include <stdio.h>
#include <string.h>
#include <time.h>

#include <err.h>

int cpu_ms() {
    return (int)(clock() * 1000 / CLOCKS_PER_SEC);
}

int main(int argc, char** argv) {
    if (argc < 2) errx(EXIT_FAILURE, "provide the array size in KB on the command line");

    size_t size = atol(argv[1]) * 1024;
    unsigned char *p = malloc(size);
    if (!p) errx(EXIT_FAILURE, "malloc of %zu bytes failed", size);

    int fill = argv[2] ? argv[2][0] : 'x';
    memset(p, fill, size);

    int startms = cpu_ms();
    printf("allocated %zu bytes at %p and set it to %d in %d ms\n", size, p, fill, startms);

    // wait until 500ms has elapsed from start, so that perf gets the read phase
    while (cpu_ms() - startms < 500) {}
    startms = cpu_ms();

    // we start measuring with perf here
    unsigned char sum = 0;
    for (size_t off = 0; off < 64; off++) {
        for (size_t i = 0; i < size; i += 64) {
            sum += p[i + off];
        }
    }

    int delta = cpu_ms() - startms;
    printf("sum was %u in %d ms \n", sum, delta);

    return EXIT_SUCCESS;
}
This allocates an array of size bytes (which is passed in on the command line, in KiB), sets all bytes to the same value (the memset call), and finally loops over the array in a read-only manner, striding by one cache line (64 bytes), and repeats this 64 times so that each byte is accessed once.
If we turn prefetching off1, we expect this to hit 100% in a given level of cache if size fits in the cache, and to mostly miss at that level otherwise.
I'm interested in two events l2_lines_out.silent and l2_lines_out.non_silent (and also l2_trans.l2_wb - but the values end up identical to non_silent), which counts lines that are silently dropped from l2 and that are not.
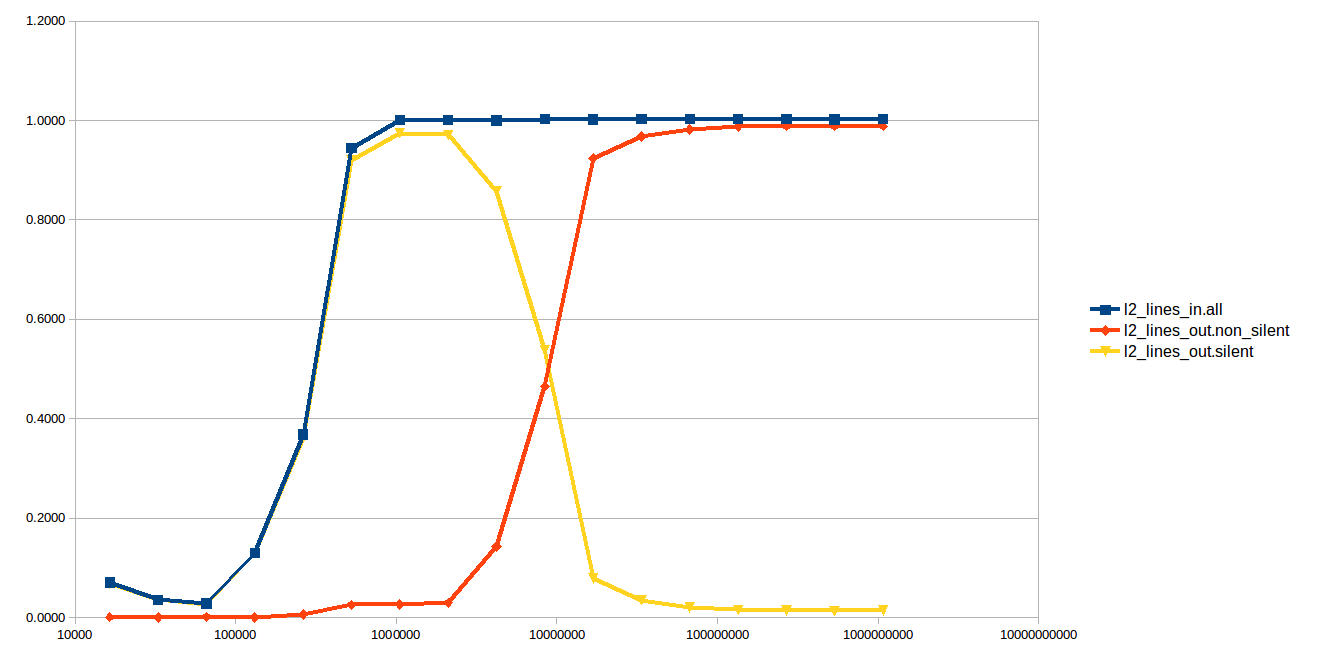
If we run this from 16 KiB up through 1 GiB, and measure these two events (plus l2_lines_in.all) for the final loop only, we get:
The y-axis here is the number of events, normalized to the number of accesses in the loop. For example, the 16 KiB test allocates a 16 KiB region, and makes 16,384 accesses to that region, and so a value of 0.5 means that on average 0.5 counts of the given event occurred per access.
The l2_lines_in.all behaves almost as we'd expect. It starts off around zero and when the size exceeds the L2 size it goes up to 1.0 and stays there: every access brings in a line.
The other two lines behave weirdly. In the region where the test fits in the L3 (but not in the L2), the eviction are nearly all silent. However, as soon as the region moves into main memory, the evictions are all non-silent.
What explains this behavior? It's hard to understand why the evictions from L2 would depend on whether the underlying region fits in main memory.
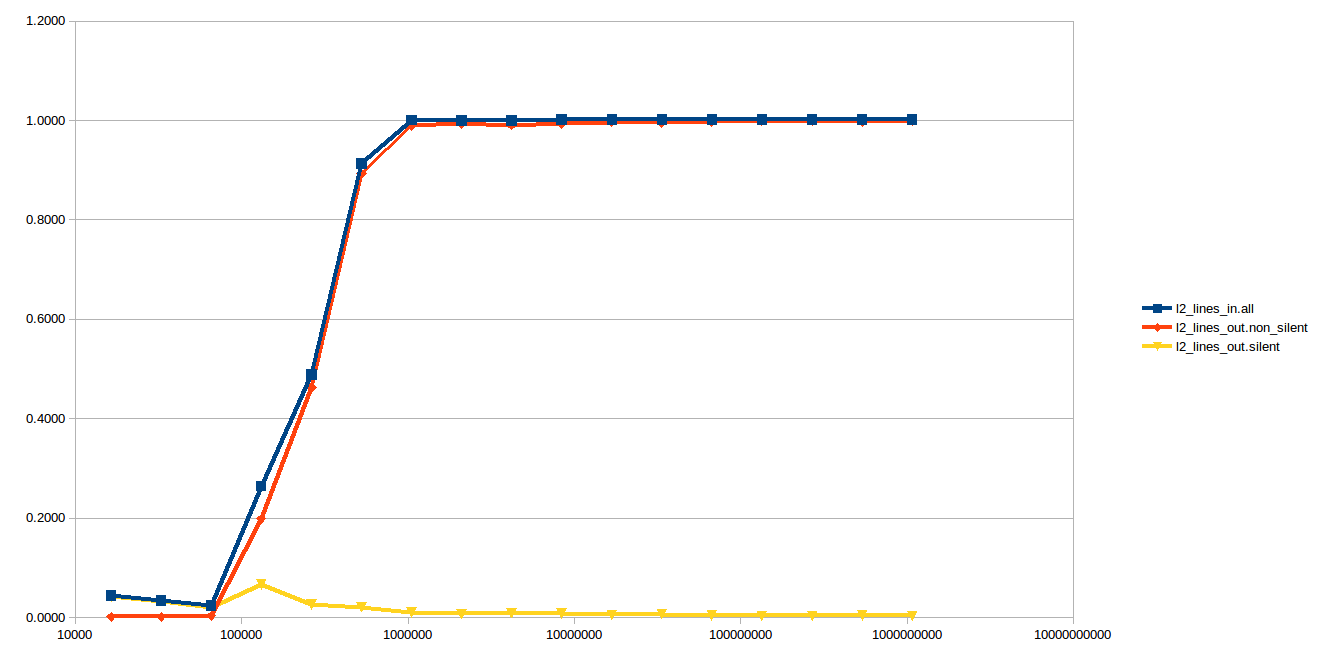
If you do stores instead of loads, almost everything is a non-silent writeback as expected, since the update value has to be propagated to the outer caches:
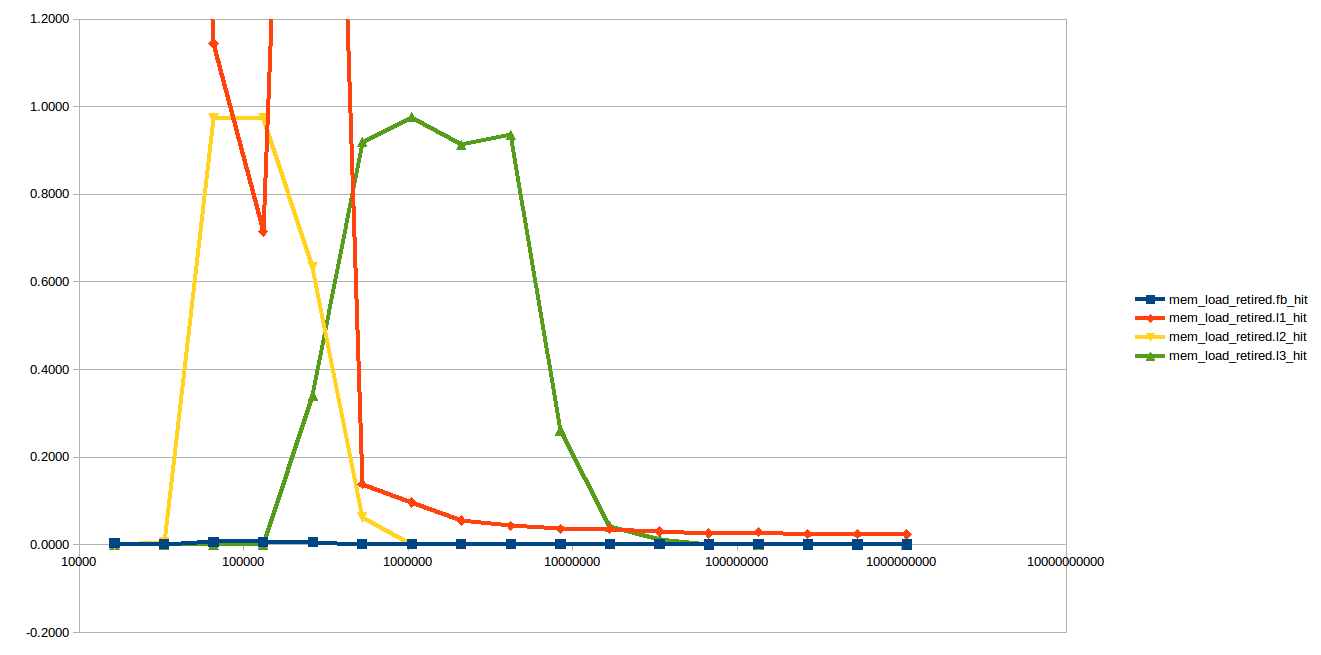
We can also take a look at what level of the cache the accesses are hitting in, using the mem_inst_retired.l1_hit and related events:
If you ignore the L1 hit counters, which seem impossibly high at a couple of points (more than 1 L1 hit per access?), the results look more or less as expected: mostly L2 hits when the the region fits cleanly in L2, mostly L3 hits for the L3 region (up to 6 MiB on my CPU), and then misses to DRAM thereafter.
You can find the code on GitHub. The details on building and running can be found in the README file.
I observed this behavior on my Skylake client i7-6700HQ CPU. The same effect seems not to exist on Haswell2. On Skylake-X, the behavior is totally different, as expected, as the L3 cache design has changed to be something like a victim cache for the L2.
1 You can do it on recent Intel with wrmsr -a 0x1a4 "$((2#1111))". In fact, the graph is almost exactly the same with prefetch on, so turning it off is mostly just to eliminate a confounding factor.
2 See the comments for more details, but briefly l2_lines_out.(non_)silent doesn't exist there, but l2_lines_out.demand_(clean|dirty) does which seem to have a similar definition. More importantly, the l2_trans.l2_wb which mostly mirrors non_silent on Skylake exists also on Haswell and appears to mirror demand_dirty and it also does not exhibit the effect on Haswell.


L2_LINES_OUT.SILENTandL2_LINES_OUT.NON_SILENTare only available on Skylake. Or do they have different names on Haswell? They also seem to exist in older microarchs and calledL2_LINES_OUT.DEMAND_CLEANandL2_LINES_OUT.DEMAND_DIRTY. – SmigaL2_LINES_OUT.DEMAND_CLEANandL2_LINES_OUT.DEMAND_DIRTYexist on Haswell by these names. It's just that the umasks are different. – Smigal2_trans.l2_wbandl2_lines_out.non_silentare both almost zero for all array sizes.l2_lines_out.silentbecomes flat at around 0.8 per access once the array becomes larger than the L2.l2_lines_in.allis as expected. – Smigal2_lines_out.non_silentalso identical tol2_trans.l2_wb? – Smigal2_lines_out.non_silentoverlaps it completely and obscures it. The counts are often identical or off by 1 or 2. The very small differences could be attributable to the non-atomic nature ofperfreads of the performance counters. You can see the raw csv results here, columns 2 and 4. – Ewersl2_trans.l2_wbis about twice as large asL2_LINES_OUT.DEMAND_DIRTY. In both the store and load cases, it appears that thel2_trans.l2_wbevents include all the events fromL2_LINES_OUT.DEMAND_DIRTY. In addition,l2_trans.l2_wbis exclusive ofL2_LINES_OUT.DEMAND_CLEAN. It's not clear to me whatL2_LINES_OUT.DEMAND_DIRTYis counting. – Smigal2_lines_out.non_silentnot zero. I think this means that initially, the lines are brought in the L2 but not the L3. But then the L2 starts writing back the line into the L3 until the L3 experiences a very high hit rate and then the L2 stops writing back the lines. Basically the L2 dynamically monitors the L3 hit rate. If it's low, it keep write back lines whether clean or dirty in an attempt to increase the hit rate of L3. If it's high, it stops writing back clean lines. This would explain the graph. – Smigawbvsdemand_dirty. Definitely different but not 2x. I don't know what causes the difference. This is PF on, I'm chekcing now PF off. – Ewersmem_inst_retired.*_hitgraphs, which is maybe what you were asking for hits and misses. The counts look "as expected" except that L1 hits are weird (but I think we can ignore that). – Ewers