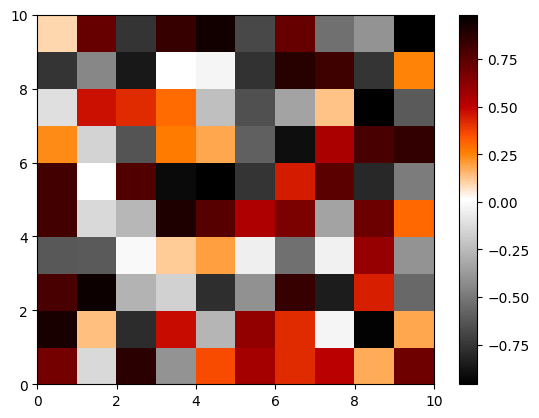
I would like to merge two colormaps into one, such that I can use one cmap for negative values and the other one for positive values.
At the moment I do it with masked arrays and plotting one image with one cmap and the other image with the other, resulting in:

with the following data
dat = np.random.rand(10,10) * 2 - 1
pos = np.ma.masked_array(dat, dat<0)
neg = np.ma.masked_array(dat, dat>=0)
I plotted pos with gist_heat_r and neg with binary.
I would like to have a single colorbar with the combined cmap's, so this is not the correct approach for me.
So, how do I take two existing cmaps's and merge them into one?
EDIT: I admit, this is a duplicate, but the answer that's given is much more clear here. Also the example images make it more clear.


plt.cm.RdGy. This yields a continuous map around zero. If I'm not mistaken you have a discontinuity at 0. Is that what you want? – Temperature