How do I change the color for ng2-charts?
Asked Answered
E

6

33

I have added ng2-charts to my project and display 2 charts - donut & barchart. both are displayed in gray since I added

    <base-chart class="chart"
                [colors]="chartColors"
                ...
    </base-chart> 

to the component.template.html, and

public chartColors:Array<any> =[
    {
      fillColor:'rgba(225,10,24,0.2)',
      strokeColor:'rgba(11,255,20,1)',
      pointColor:'rgba(111,200,200,1)',
      pointStrokeColor:'#fff',
      pointHighlightFill:'#fff',
      pointHighlightStroke:'rgba(200,100,10,0.8)'
    }, ... (3x)

to the component.ts.

Are any other package imports necessary to change the color or is the setup wrong?

Chromes html inspector shows the following html output rendered:

ng-reflect-colors="[object Object],[object Object],[object Object]"
Ellora answered 3/10, 2016 at 13:29 Comment(0)
B
50

You should do this like:

  public chartColors: Array<any> = [
    { // first color
      backgroundColor: 'rgba(225,10,24,0.2)',
      borderColor: 'rgba(225,10,24,0.2)',
      pointBackgroundColor: 'rgba(225,10,24,0.2)',
      pointBorderColor: '#fff',
      pointHoverBackgroundColor: '#fff',
      pointHoverBorderColor: 'rgba(225,10,24,0.2)'
    },
    { // second color
      backgroundColor: 'rgba(225,10,24,0.2)',
      borderColor: 'rgba(225,10,24,0.2)',
      pointBackgroundColor: 'rgba(225,10,24,0.2)',
      pointBorderColor: '#fff',
      pointHoverBackgroundColor: '#fff',
      pointHoverBorderColor: 'rgba(225,10,24,0.2)'
    }];

Gray color is set by default, which means your color options don't work, because of wrong properties names.

Here you have an example, how colors properties are called:

ng2-charts-github-source-code

@UPDATE:

If there is a need to update just backgroundColor and nothing else, code below will work too.

public chartColors: Array<any> = [
    { // all colors in order
      backgroundColor: ['#d13537', '#b000b5', '#c0ffee', ...]
    }
]
Became answered 3/10, 2016 at 13:40 Comment(4)
@ulon In my case its displaying only first colorSynchronize
@Became is there any way to change the dougnut chart color ?.Partner
@A.Sakkeer Check this one: github.com/valor-software/ng2-charts/issues/955Became
Is there a way to change the legend color? In my use case, i am having a dark theme for my web app and dont know how to set the dark theme for the ng2-chart in angular or at least change the legend text color to white. I am using angular and ng2-charts btw.Scurrile
R
52

Also you can do it in this way:

<base-chart class="chart"
            [colors]="chartColors"
            ...
</base-chart>

and

public chartColors: any[] = [
      { 
        backgroundColor:["#FF7360", "#6FC8CE", "#FAFFF2", "#FFFCC4", "#B9E8E0"] 
      }];
Reality answered 23/2, 2017 at 16:37 Comment(2)
Two hours later and this was the answer. Nowhere else do they show to put an array to the backgroundColor property of an object within an array. I was at the end of my rope until this post!Brominate
A slight variation of this worked for me just now: [ { backgroundColor: '#FF7360' }, { backgroundColor: '#6FC8Ce' }, ... ]Edson
B
50

You should do this like:

  public chartColors: Array<any> = [
    { // first color
      backgroundColor: 'rgba(225,10,24,0.2)',
      borderColor: 'rgba(225,10,24,0.2)',
      pointBackgroundColor: 'rgba(225,10,24,0.2)',
      pointBorderColor: '#fff',
      pointHoverBackgroundColor: '#fff',
      pointHoverBorderColor: 'rgba(225,10,24,0.2)'
    },
    { // second color
      backgroundColor: 'rgba(225,10,24,0.2)',
      borderColor: 'rgba(225,10,24,0.2)',
      pointBackgroundColor: 'rgba(225,10,24,0.2)',
      pointBorderColor: '#fff',
      pointHoverBackgroundColor: '#fff',
      pointHoverBorderColor: 'rgba(225,10,24,0.2)'
    }];

Gray color is set by default, which means your color options don't work, because of wrong properties names.

Here you have an example, how colors properties are called:

ng2-charts-github-source-code

@UPDATE:

If there is a need to update just backgroundColor and nothing else, code below will work too.

public chartColors: Array<any> = [
    { // all colors in order
      backgroundColor: ['#d13537', '#b000b5', '#c0ffee', ...]
    }
]
Became answered 3/10, 2016 at 13:40 Comment(4)
@ulon In my case its displaying only first colorSynchronize
@Became is there any way to change the dougnut chart color ?.Partner
@A.Sakkeer Check this one: github.com/valor-software/ng2-charts/issues/955Became
Is there a way to change the legend color? In my use case, i am having a dark theme for my web app and dont know how to set the dark theme for the ng2-chart in angular or at least change the legend text color to white. I am using angular and ng2-charts btw.Scurrile
S
5

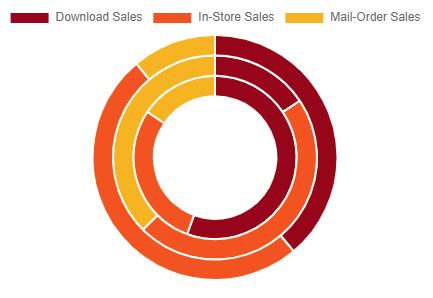
If you're like me using a doughnut type chart with ng2-charts' MultiDataSet, and want to change the colors, then you will need to do something like this:

public doughnutChartColors: Color[] = [
  {backgroundColor:["#9E120E","#FF5800","#FFB414"]},
  {backgroundColor:["#9E120E","#FF5800","#FFB414"]},
  {backgroundColor:["#9E120E","#FF5800","#FFB414"]}
];

colors property in chart is like:

<canvas baseChart
  [data]="doughnutChartData"
  [labels]="doughnutChartLabels"
  [chartType]="doughnutChartType"
  [colors]="doughnutChartColors">
</canvas>

Chart looks like:

enter image description here

And BTW.. there is a good answer here discussing accessible colors.

My stackblitz with Doughnut Chart demo.

Sanjuanitasank answered 17/6, 2020 at 7:10 Comment(2)
Is there a way to change the legend color? In my use case, i am having a dark theme for my web app and dont know how to set the dark theme for the ng2-chart in angular or at least change the legend text color to white. I am using angular and ng2-charts btwScurrile
Updated answer with link to my stackblitz. Read the documentation about ThemeService: valor-software.com/ng2-charts and see if you can get it working there. Then share your fork.Sanjuanitasank
T
3
//.ts_file     

    public chartColors() {
            return [{
              backgroundColor: this.alert.severityColor,
              borderColor: 'rgba(225,10,24,0.2)',
              pointBackgroundColor: 'rgba(225,10,24,0.2)',
              pointBorderColor: '#fff',
              pointHoverBackgroundColor: '#fff',
              pointHoverBorderColor: 'rgba(225,10,24,0.2)'
          }]
        }


//.html_file

<div style="display: block">
          <canvas baseChart
                  [datasets]="barChartData()"
                  [options]="barChartOptions"
                  [legend]="barChartLegend"
                  [chartType]="barChartType"
                  [colors]="chartColors()"
                  (chartHover)="chartHovered($event)"
                  (chartClick)="chartClicked($event)"></canvas>
        </div>

I needed to change the color of the charts dynamically based on values and colors attached to alerts. I found that @uluo had a great answer. I changed it from a property of the class to a function and returned the object with the colors set to dynamic elements in my alerts. Then I used the function to bind my chart colors and it was magic. I had been stuck on this problem for a couple of hours!

Hope this helps anyone who is trying to pass in dynamic values to ng2-charts with Angular!

Tripe answered 21/2, 2019 at 19:23 Comment(0)
N
2

Chart colours can be set via the chart data. Useful to match specific colours to specific series.

e.g. remove or ignore the [colors] attribute and for a data specification

<canvas style="height: 600px" baseChart
        chartType="bar"
        [datasets]="chartData"

set chartData

[
  {
    "data": [
      {
        "y": 18353021615,
        "t": 2014
      },
    ],
    "label": "Energy",
    "backgroundColor": "rgb(229,229,229)",
    "pointBackgroundColor": "rgba(229, 229, 229, 1)",
    "pointHoverBackgroundColor": "rgba(151,187,205,1)",
    "borderColor": "rgba(0,0,0,0)",
    "pointBorderColor": "#fff",
    "pointHoverBorderColor": "rgba(151,187,205,1)"
  },

Or so the following test would pass

expect(component.chartData[0].backgroundColor).toBe('rgba(242,200,124,1)');

I have a template set of default colours

public readonly localChartColours: Color[] = [
{
  backgroundColor: 'rgb(78,180,189)',
  pointBackgroundColor: 'rgba(78, 180, 189, 1)',
  pointHoverBackgroundColor: 'rgba(151,187,205,1)',
  borderColor: 'rgba(0,0,0,0)',
  pointBorderColor: '#fff',
  pointHoverBorderColor: 'rgba(151,187,205,1)'
}, {

Set the colours when setting the data

const chartDataPrototype = {data: points, label: seriesLabel};
const coloursForItem = this.findColours(this.chartData.length);
Object.keys(coloursForItem).forEach(colourProperty => {
  chartDataPrototype[colourProperty] = coloursForItem[colourProperty];
});
this.chartData.push(chartDataPrototype);

And overwrite them on a specific basis as needed

this.chartData.forEach(item => {
  if (uopColours[item.label]) {
      item.backgroundColor = uopColours[item.label];
  }
Nerve answered 7/10, 2020 at 5:3 Comment(0)
L
0

Colors can also be set/changed within the scope of the dataset array ifself like below (for a bar chart example):

public barChartData: ChartData<'bar'> = {
labels: this.barChartLabels,
datasets: [
  {
    data: [5000, 5000, 5100],
    label: 'Income',
    **>>backgroundColor: ['green','green','green']<<**,
  },
  {
    data: [4100, 3500, 3950],
    label: 'Expenses',
    **>>backgroundColor: ['red','red','red']<<**,
  },
],
};

Hope this helps.

Lipson answered 30/8, 2022 at 8:51 Comment(0)

© 2022 - 2024 — McMap. All rights reserved.