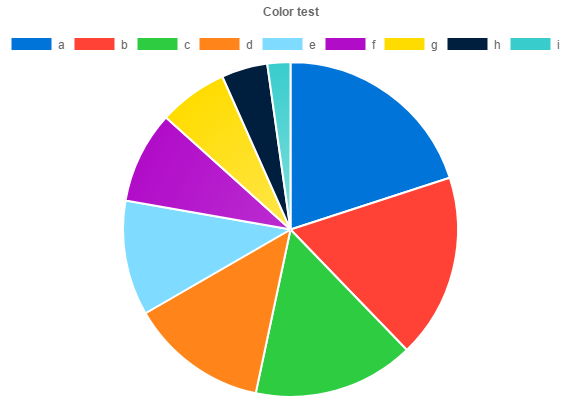
First of all, there are a lot of color blind people out there. Here is a nice article about charts and color blindness:
Finding the Right Color Palettes for Data Visualizations
This uses Chart.js 2.4.0
I'm calculating the different colors from a gradient like this:
![enter image description here]()
This gives a nice cohesive look. I have borrowed the palettes from the link above. I have only tested with doughnut, bar and line charts, but it should be easy enough to add other types. You can also easily make your own gradients.
You can find a jsfiddle here.
HTML:
<div>
    <button onclick="doughnut();">Doughnut</button>
    <button onclick="lineBar('bar')">Bar</button>
    <button onclick="lineBar('line')">Line</button>
</div>
<div>
    <button onclick="chartColors('cool');">Cool</button>
    <button onclick="chartColors('warm')">Warm</button>
    <button onclick="chartColors('neon')">Neon</button>
</div>
<hr />
<canvas id="canvas"></canvas>
<hr />
Palettes borrowed from:<br />
<a href="https://blog.graphiq.com/finding-the-right-color-palettes-for-data-visualizations-fcd4e707a283">
    Finding the Right Color Palettes for Data Visualizations
</a>
Javascript:
var ctx = document.getElementById('canvas').getContext('2d');
var chart;
var currentPalette = "cool";

function doughnut() {
    if (chart) chart.destroy();
    chart = new Chart(ctx, {
        type: 'doughnut',
        data: {
            labels: ["Bananas", "Street lights", "Emotions", "Colors", "Children", "Nodes"],
            datasets: [{
                data: [1, 2, 6, 9, 1, 2],
            }]
        },
    });
    chartColors();
}

function lineBar(type) {
    if (chart) chart.destroy();
    chart = new Chart(ctx, {
        type: type,
        data: {
            labels: ["Monday", "Tuesday", "Wednesday", "Thursday", "Friday", "Saturday"],
            datasets: [{
                label: "Bananas",
                data: [1, 2, 6, 9, 1, 2]
            }, {
                label: "Street lights",
                data: [2, 6, 9, 1, 2, 7]
            }, {
                label: "Emotions",
                data: [2, 4, 6, 8, 6, 4]
            }, {
                label: "Colors",
                data: [3, 6, 3, 1, 3, 1]
            }, {
                label: "Children",
                data: [4, 4, 4, 5, 5, 5]
            }, {
                label: "Nodes",
                data: [5, 1, 2, 3, 4, 5]
            }, ]
        },
    });
    chartColors();
}

function chartColors(palette) {
    if (!palette) palette = currentPalette;
    currentPalette = palette;

    /*Gradients
      The keys are percentage and the values are the color in a rgba format.
      You can have as many "color stops" (%) as you like.
      0% and 100% is not optional.*/
    var gradient;
    switch (palette) {
        case 'cool':
            gradient = {
                0: [255, 255, 255, 1],
                20: [220, 237, 200, 1],
                45: [66, 179, 213, 1],
                65: [26, 39, 62, 1],
                100: [0, 0, 0, 1]
            };
            break;
        case 'warm':
            gradient = {
                0: [255, 255, 255, 1],
                20: [254, 235, 101, 1],
                45: [228, 82, 27, 1],
                65: [77, 52, 47, 1],
                100: [0, 0, 0, 1]
            };
            break;
        case 'neon':
            gradient = {
                0: [255, 255, 255, 1],
                20: [255, 236, 179, 1],
                45: [232, 82, 133, 1],
                65: [106, 27, 154, 1],
                100: [0, 0, 0, 1]
            };
            break;
    }

    //Get a sorted array of the gradient keys
    var gradientKeys = Object.keys(gradient);
    gradientKeys.sort(function(a, b) {
        return +a - +b;
    });

    //Find datasets and length
    var chartType = chart.config.type;
    switch (chartType) {
        case "pie":
        case "doughnut":
            var datasets = chart.config.data.datasets[0];
            var setsCount = datasets.data.length;
            break;
        case "bar":
        case "line":
            var datasets = chart.config.data.datasets;
            var setsCount = datasets.length;
            break;
    }

    //Calculate colors
    var chartColors = [];
    for (i = 0; i < setsCount; i++) {
        var gradientIndex = (i + 1) * (100 / (setsCount + 1)); //Find where to get a color from the gradient
        for (j = 0; j < gradientKeys.length; j++) {
            var gradientKey = gradientKeys[j];
            if (gradientIndex === +gradientKey) { //Exact match with a gradient key - just get that color
                chartColors[i] = 'rgba(' + gradient[gradientKey].toString() + ')';
                break;
            } else if (gradientIndex < +gradientKey) { //It's somewhere between this gradient key and the previous
                var prevKey = gradientKeys[j - 1];
                var gradientPartIndex = (gradientIndex - prevKey) / (gradientKey - prevKey); //Calculate where
                var color = [];
                for (k = 0; k < 4; k++) { //Loop through Red, Green, Blue and Alpha and calculate the correct color and opacity
                    color[k] = gradient[prevKey][k] - ((gradient[prevKey][k] - gradient[gradientKey][k]) * gradientPartIndex);
                    if (k < 3) color[k] = Math.round(color[k]);
                }
                chartColors[i] = 'rgba(' + color.toString() + ')';
                break;
            }
        }
    }

    //Copy colors to the chart
    for (i = 0; i < setsCount; i++) {
        switch (chartType) {
            case "pie":
            case "doughnut":
                if (!datasets.backgroundColor) datasets.backgroundColor = [];
                datasets.backgroundColor[i] = chartColors[i];
                if (!datasets.borderColor) datasets.borderColor = [];
                datasets.borderColor[i] = "rgba(255,255,255,1)";
                break;
            case "bar":
                datasets[i].backgroundColor = chartColors[i];
                datasets[i].borderColor = "rgba(255,255,255,0)";
                break;
            case "line":
                datasets[i].borderColor = chartColors[i];
                datasets[i].backgroundColor = "rgba(255,255,255,0)";
                break;
        }
    }

    //Update the chart to show the new colors
    chart.update();
}

doughnut();
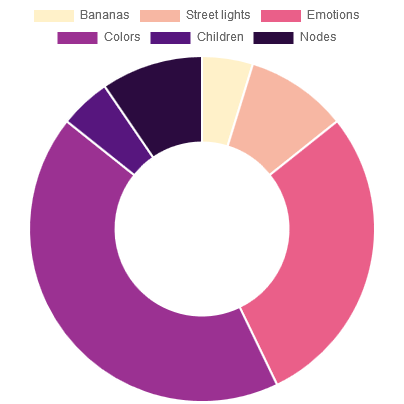
This would give something like this:
![enter image description here]()


