Align grid with ticks
Asked Answered
J

2

1

When I let plot draw the axis, grid aligns with ticks by default.

However, my plot is somewhat involved:

mytime <- as.POSIXct("2015-08-20") + seq(0,by=3600,length.out=7*24)
plot(x=mytime,y=rnorm(7*24),xaxt="n")
ticks <- mytime[seq(1,by=12,to=length(mytime))]
axis(1, ticks, strftime(ticks, "%a %H:%M"))
grid(ny=NULL,nx=14)

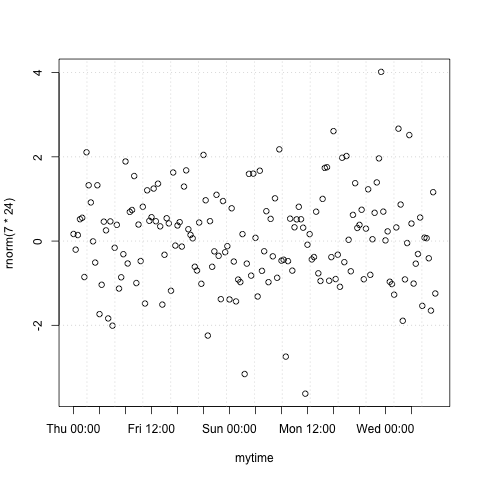
and I cannot get the grid to align with the ticks:

grid and ticks do not align

How do I make them align?

Jamijamie answered 20/8, 2015 at 13:57 Comment(0)
J
0

Looks like abline is the answer:

mytime <- as.POSIXct("2015-08-20") + seq(0,by=3600,length.out=7*24)
plot(x=mytime,y=rnorm(7*24),xaxt="n")
ticks <- c(mytime[seq(1,by=12,to=length(mytime))],mytime[1]+7*24*3600)
axis(1, ticks, strftime(ticks, "%a %H:%M"))
grid(ny=NULL,nx=NA)
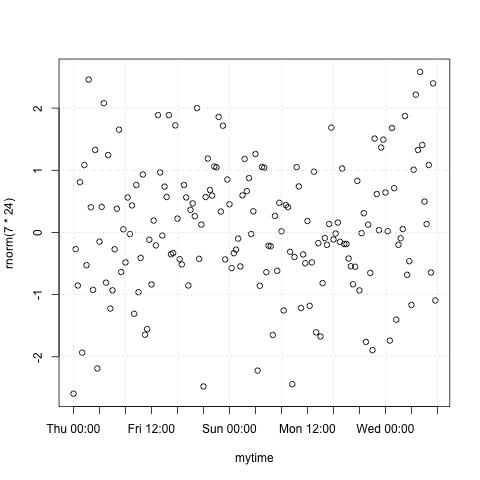
abline(v=ticks[seq(1,length(ticks),2)],lty="dotted",col="lightgray")

enter image description here

Jamijamie answered 20/8, 2015 at 17:34 Comment(0)
S
2

As pointed in the previous answer, the solution is using the abline function and avoid that the vertical guidelines are plotted in wrong locations. You can achieve both things by replacing the last line of your code

grid(ny=NULL,nx=14)

by

grid(ny=NULL,nx=NA)
abline(v = ticks, lty = 3, col = "lightgray")

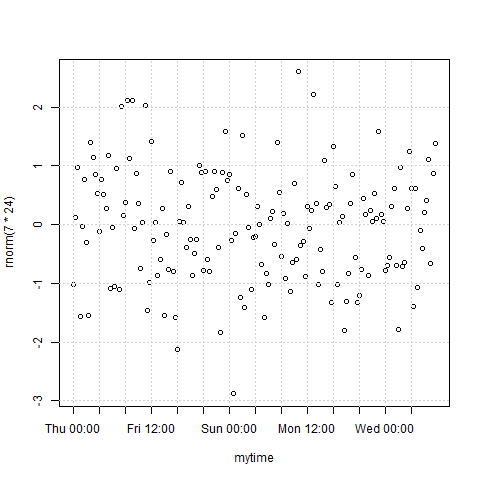
to obtain

enter image description here

By the way, there are previous questions related to this that could have helped you:

  1. R: Finding the location of tick marks when plotting dates
  2. Align grid() to plot ticks
Scoggins answered 4/4, 2020 at 22:23 Comment(0)
J
0

Looks like abline is the answer:

mytime <- as.POSIXct("2015-08-20") + seq(0,by=3600,length.out=7*24)
plot(x=mytime,y=rnorm(7*24),xaxt="n")
ticks <- c(mytime[seq(1,by=12,to=length(mytime))],mytime[1]+7*24*3600)
axis(1, ticks, strftime(ticks, "%a %H:%M"))
grid(ny=NULL,nx=NA)
abline(v=ticks[seq(1,length(ticks),2)],lty="dotted",col="lightgray")

enter image description here

Jamijamie answered 20/8, 2015 at 17:34 Comment(0)

© 2022 - 2024 — McMap. All rights reserved.