Add custom legend without any relation to the graph
Asked Answered
V

2

36

I wish to insert a legend that is not related to the graph whatsoever:

figure;
hold on;
plot(0,0,'or');
plot(0,0,'ob');
plot(0,0,'ok');
leg = legend('red','blue','black');

Now I wish to add it to another figure:

figure;
t=linspace(0,10,100);
plot(t,sin(t));
%% ADD THE LEGEND OF PLOT ABOVE 
Vaas answered 2/11, 2015 at 9:16 Comment(7)
this is a simple example of a bigger thing I have so what you suggest is not relevant, there must be a way to do itVaas
So it is not clear what you want to achieve. Can you provide more information? Why do you need legend if there is no related data in the plot.Disagreeable
what I want to achieve is exactly what I wrote, use the box with the legend of the first figure, and have it displayed on the secondVaas
2 hacky options: (1) add empty lineserie (or any empty graphic object) in the axes so that there are enough to populate the legend. (2, better in my view) make your own legend object (it's only a special axes object after all) which you can then move/copy/modify freely within your figures. Example on how to do that can be found here: plot-legend-title.Rilke
I found a way to work it through, just add the (0,0) plots before the other one and make them 'visible','off'Vaas
You can even use NaN instead of 0 for your plot data. This way you don't even have to touch the visible property, nothing will be displayed anyway (the legend will still accept the data serie as a valid entry).Rilke
With modern MATLAB versions, i.e. since 2016b, you can use the 'MarkerIndices' command while doing the plot to put a marker in a specific location. See es.mathworks.com/help/matlab/creating_plots/… for more information.Maloriemalory
U
49

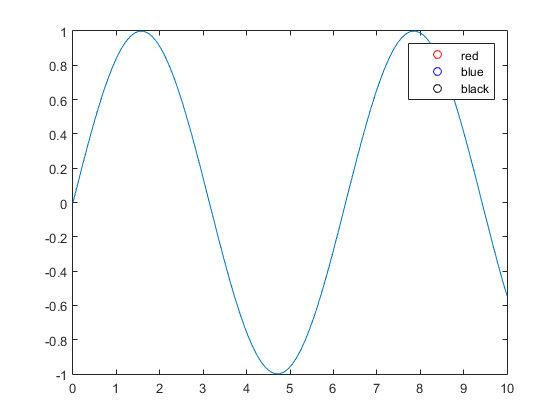
This is how I have solved this problem in the past:

figure
t=linspace(0,10,100);
plot(t,sin(t));
hold on;

h = zeros(3, 1);
h(1) = plot(NaN,NaN,'or');
h(2) = plot(NaN,NaN,'ob');
h(3) = plot(NaN,NaN,'ok');
legend(h, 'red','blue','black');

This will plot the additional points, but because the coordinates are at NaN they will not be visible on the plot itself:

enter image description here

EDIT 26/10/2016: My original answer results in greyed out legend entries in 2016b. The updated code above works, but the answer below is only relevant pre-2016b:

figure
t=linspace(0,10,100);
plot(t,sin(t));
hold on;

h = zeros(3, 1);
h(1) = plot(0,0,'or', 'visible', 'off');
h(2) = plot(0,0,'ob', 'visible', 'off');
h(3) = plot(0,0,'ok', 'visible', 'off');
legend(h, 'red','blue','black');

This will plot the additional points, but they will not be visible on the plot itself.

You can also use copyobj to copy graphics elements from one figure to another if you have a lot of elements, then use set(x, 'visible', 'off') to hide them before showing the legend, but it depends on what your final application is.

Untangle answered 2/11, 2015 at 10:10 Comment(3)
as commented above u can use NaN, and then u do not need to use the visible handleVaas
@vindarmagnus, ouch, yes, you're right! I have updated my answer to use NaN coordinates instead of invisible plots, as suggested by jarhead and Hoki in the comments.Untangle
Nice. (No need to pre-allocate the matrix, so can eliminate h = zeros(3, 1).)Epicrisis
A
5

Your question is a little unclear. However, the first thing I thought of when reading it was the text function in Matlab.

You can use the text function to add text to a Matlab figure. It's use is

>> text(x, y, str);

where x and y are the coordinates in the figure where you want to add the text str. You can use the Color option of text for colours and TeX to draw lines or even _. I've gotten very creative with plots using text.

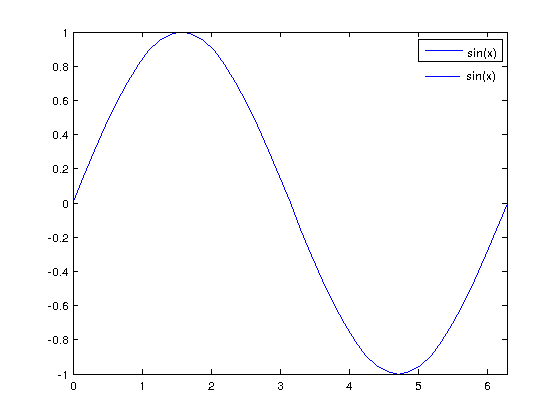
Here's a quick and dirty example of emulating a legend with text

x = 0:pi/20:2*pi;
y = sin(x);
plot(x,y)
axis tight

legend('sin(x)');

text(5.7, 0.75, 'sin(x)');
text(5.1, 0.78, '_____', 'Color', 'blue');

which produces

             <code>text</code> example

For this specific case you could use the specific command (noted by @Hoki in the comments).

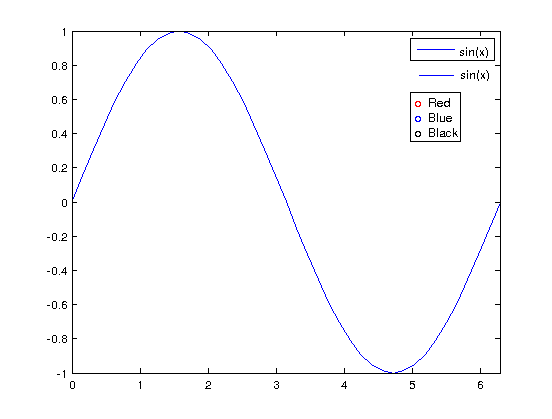
ht = text(5, 0.5, {'{\color{red} o } Red', '{\color{blue} o } Blue', '{\color{black} o } Black'}, 'EdgeColor', 'k');

to produce

             <code>text</code> example

by retrieving the handle to the text object it becomes trivial to copy it to a new figure, copyobj(ht, newfig). [1]

Aforethought answered 2/11, 2015 at 9:31 Comment(7)
However text does not provide the color and format that legend provides.Disagreeable
You can use the Color option of text for colours and TeX to draw lines or even _. I've gotten very creative with plots using text.Aforethought
Sounds interesting, could you give a small example of a TeX and Color syntax in text objects ?Rilke
@Rilke Just added a really simple and quick example there.Aforethought
Nice. You can also modify colour partially in one text zone (with TeX color markup), and have multiple lines of text in one text object. So you could define the legend in one go !. Try this : ht = text(5,0,{'{\color{red} o } Red (serie 1)','{\color{blue} o } Blue (serie 2)','{\color{black} o } Black (serie 3)'},'EdgeColor','k') ;. This way you don't have to define multiple text objects.Rilke
@Rilke I thought so! When I first found it I spent a whole day messing around with it. I hope you don't mind but I added your command and picture to the answer just for extra illustration. I've never found a way to draw straight lines with Matlab's TeX engine though which I find a bummer.Aforethought
I definitely don't mind. I was hoping you'd reproduce the example ;-). It's not different enough from your answer to deserve a separate answer, but it gives extra info/options to build a nice looking legend so it is worth mentioning. Me too I miss a way to draw nice lines with text. Also, in case your line symbols are different, you may consider using a fixed size font in order to keep a nice alignment (it can get quite ugly). Last advice, I would retrieve the handle of the text object created, this way it becomes trivial to use the same object in another figure: copyobj(ht,newfig).Rilke

© 2022 - 2024 — McMap. All rights reserved.