How can identify strong reference cycles in Swift?
Asked Answered
S

5

37

Is there a tool or method to locate strong references cycles in my SWIFT code?

A strong reference cycle is when two instances of classes reference each other without the proper safeties (weak/unowned) hence preventing the garbage collector from disposing of them once all the variables I created stopped referencing those objects.

Sebaceous answered 28/8, 2015 at 1:55 Comment(2)
I am new to this eco system (so no knowledge of Objective C), So, it is ARC from now on.Sebaceous
That's OK, as the concepts are largely the same. I'd be surprised if you see discussions in Objective-C strong reference cycles and weren't able to immediately apply that to your Swift programming (esp since you're familiar with unowned and weak syntax in Swift).Androclinium
A
51

The method for finding strong reference cycles is the same in Swift as in Objective-C.

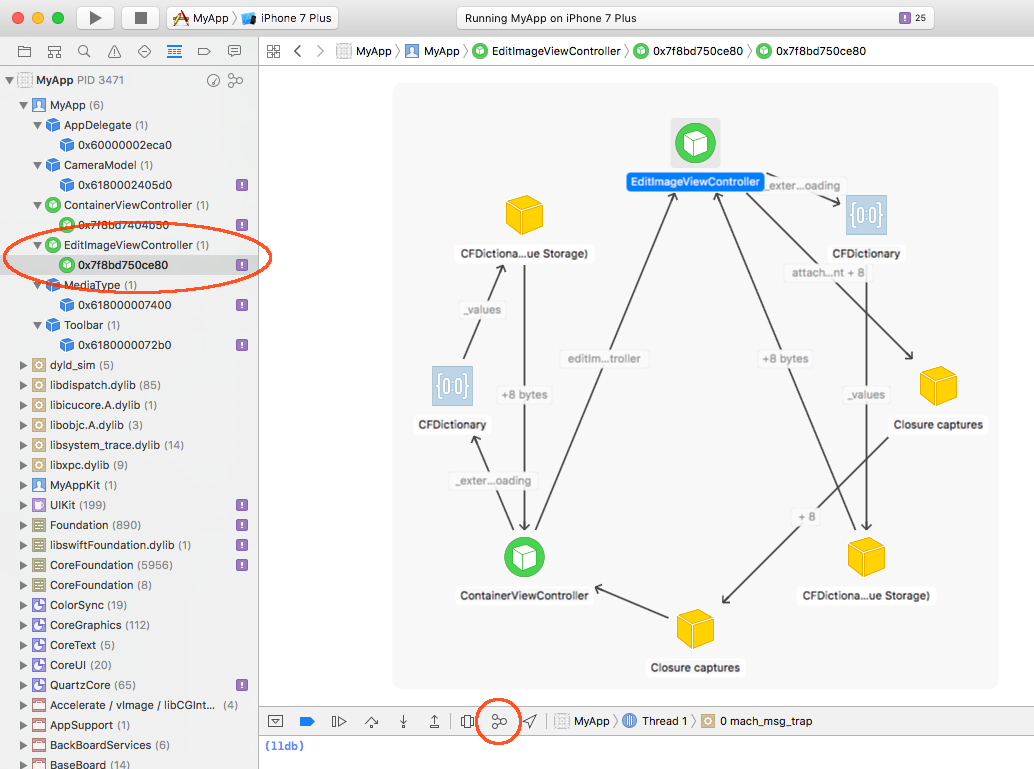
You'd run the app from Xcode, exercise the app sufficiently to manifest the cycle, and then tap on the "debug memory graph" button (debug memory graph). You can then select an unreleased object in the panel on the left, and it will show you the memory graph, often which can clearly illustrate the strong reference cycles:

debug memory graph

Sometimes the memory cycles are not as obvious as that, but you can at least see what object is keeping a strong reference to the object in question. If necessary, you can then track backward and identify what's keeping a strong reference to that, and so on.

Sometimes knowing what sort of object is keeping the strong reference is insufficient, and you really want to know where in your code that strong reference was established. The "malloc stack" option, as shown in https://mcmap.net/q/110608/-how-to-debug-memory-leaks-when-leaks-instrument-does-not-show-them, can be used to identify what the call stack was when this strong reference was established (often letting you identify the precise line of code where these strong references were established). For more information, see WWDC 2016 video Visual Debugging with Xcode.

You can also use Instruments to identify leaked object. Just run the app through Instruments with the Allocations tool, repeatedly (not just once or twice) returning the app back to some steady-state condition, and if memory continues to go up, then you likely have a strong reference cycle. You can use the Allocations tool to identify what type of objects are not being released, use "record reference count" feature to determine precisely where these strong references were established, etc.

See WWDC 2013 video Fixing Memory Issues and WWDC 2012 video iOS App Performance: Memory for introductions to identifying and resolving memory issues. The basic techniques proposed there are still applicable today (though the UI of Instruments tools has changed a bit ... if you want an introduction to the slightly changed UI, see WWDC 2014 video Improving Your App with Instruments).

As an aside, "garbage collection" refers to a very different memory system and isn't applicable here.

Androclinium answered 28/8, 2015 at 2:9 Comment(2)
Maybe I misunderstand the severity of the problem here, but isn't an SRC always undesirable and a problem in your app that needs to be fixed? If so, then I don't understand why there just isn't a single button in xcode to detect SRCs? Having to click through all of the objects to manually review them seems unnecessarily painful.Topographer
You don't have to click through all the objects, just focus on the ones with the ! symbol. Better, just tap on the ⚠️ in the filter bar of the debug navigator, and you'll see only those items with issues.Androclinium
L
30

You can add deinit functions to your classes that will get called when your objects are deallocated.

If deinit isn't getting called, while your app is running, you can press the Debug Memory Graph button (circled below) and inspect what has a reference to what.

Debug Memory Graph Button

Use the dropdown menus at the top of the middle pane to toggle between classes and instances of classes.

If something is getting allocated over and over again without getting released you should see multiple instances, and you should be able to see via the directional graph if one of its children is holding a strong reference to its parent.

Lightish answered 30/3, 2017 at 19:6 Comment(0)
R
2

Use instruments to check for leaks and memory loss. Use Mark Generation (Heapshot) in the Allocations instrument on Instruments.

For HowTo use Heapshot to find memory creap, see: bbum blog

Basically the method is to run Instruments allocate tool, take a heapshot, run an iteration of your code and take another heapshot repeating 3 or 4 times. This will indicate memory that is allocated and not released during the iterations.

To figure out the results disclose to see the individual allocations.

If you need to see where retains, releases and autoreleases occur for an object use instruments:

Run in instruments, in Allocations set "Record reference counts" on (For Xcode 5 and lower you have to stop recording to set the option). Cause the app to run, stop recording, drill down and you will be able to see where all retains, releases and autoreleases occurred.

Rolo answered 28/8, 2015 at 2:7 Comment(1)
In the first sentence see: "Mark Generation". The blog post by bbum used "Heapshot" so I included that in parens: "(Heapshot)".Rolo
V
1

very simple approach is to put a print in deinitialiser

deinit {
   print("<yourviewcontroller> destroyed.")
}

ensure that you are seeing this line getting printed on the console. put deinit in all your viewcontrollers. in case if you were not able to see for particular viewcontroller, means that their is a reference cycle.possible causes are delegate being strong, closures capturing the self,timers not invaidated,etc.

Vernalize answered 28/8, 2015 at 9:28 Comment(3)
To this approach I would add a manual "binary search": disable a whole section of the code, and make sure deinit is called. Reenable half of the code, and check if deinit is still called or if it isn't. Recurse ;)Allomorph
In Swift, because it's so easy to create inline closures, there's also a higher probability of creating reference cycles inside them. Keep an eye for any closures in the code. To be safe, I usually start my closures with a [weak self] guard let weakSelf = self else {return}. Read developer.apple.com/library/ios/documentation/Swift/Conceptual/…Allomorph
Or nowadays the convention is, [weak self] in guard let self = self else { return }.Androclinium
C
0

You can use Instruments to do that. As the last paragraph of this article states:

Once Instruments opens, you should start your application and do some interactions, specially in the areas or view controllers you want to test. Any detected leak will appear as a red line in the “Leaks” section. The assistant view includes an area where Instruments will show you the stack trace involved in the leak, giving you insights of where the problem could be and even allowing you to navigate directly to the offending code.

Clive answered 28/8, 2015 at 2:2 Comment(0)

© 2022 - 2024 — McMap. All rights reserved.