How can I hide an axis of a 3d plot
Asked Answered
C

2

40

How can I make a 3D plot without showing the axes?

When plotting a 3d plot, Matplotlib not only draws the x, y, and z axes, it draws light gray grids on the x-y, y-z, and x-z planes. I would like to draw a "free-floating" 3D plot, with none of these elements.

Stuff I've tried:

# Doesn't work; this hides the plot, not the axes
my_3d_axes.set_visible(False)

# Doesn't do anything. Also, there's no get_zaxis() function.
my_3d_axes.get_xaxis().set_visible(False)
my_3d_axes.get_yaxis().set_visible(False)
Calliper answered 7/9, 2011 at 15:59 Comment(0)
R
9

ax.set_axis_off()

Just to provide a concrete and direct example of what was mentioned at https://mcmap.net/q/398093/-how-can-i-hide-an-axis-of-a-3d-plot

#!/usr/bin/env python3

import numpy as np
import matplotlib.pyplot as plt
from matplotlib.patches import Circle
import mpl_toolkits.mplot3d.art3d as art3d

fig = plt.figure()
ax = fig.add_subplot(111, projection='3d')
ax.set_axis_off()

# Draw a circle on the x=0 'wall'
p = Circle((0, 0), 1, fill=False)
ax.add_patch(p)
art3d.pathpatch_2d_to_3d(p, zdir="x")
p = Circle((0, 0), 1, fill=False)
ax.add_patch(p)
art3d.pathpatch_2d_to_3d(p, zdir="z")

ax.set_xlim(-1.2, 1.2)
ax.set_ylim(-1.2, 1.2)
ax.set_zlim(-1.2, 1.2)

plt.savefig('main.png', format='png', bbox_inches='tight')

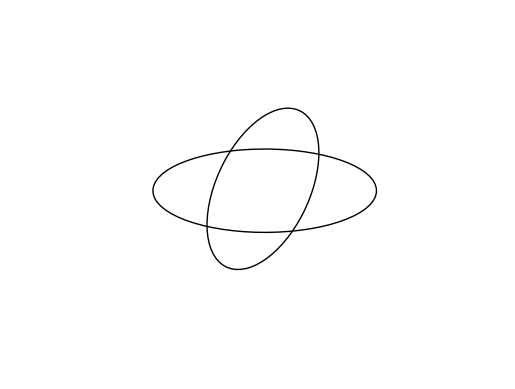
Output:

enter image description here

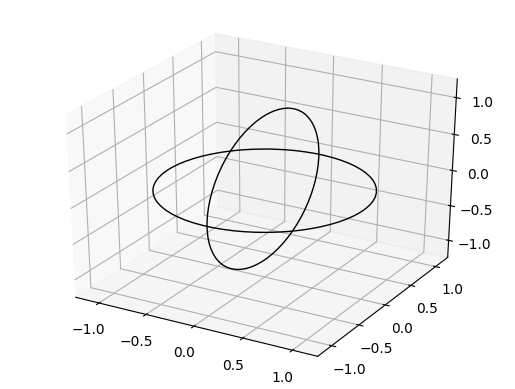
Without ax.set_axis_off() it would look like:

enter image description here

You will notice however that this produces an excessively large whitespace margin around the figure as it simply hides the axes but does not change the viewbox. I tried bbox_inches='tight' and it did not help as it does in 2D. How to solve that at: Remove white spaces in Axes3d (matplotlib)

Tested on matplotlib==3.2.2.

Ramulose answered 15/11, 2020 at 10:56 Comment(0)
C
37

Ben Root provided a patch that fixes this for 1.0.1. It can be found as an attachment to the last email of this thread. To quote Ben:

Ok, looks like the hiding of the 3d axes was a feature added after the v1.0 release (but before I started working on mplot3d). This patch should enable the basic feature without interfering with existing functions. To hide the axes, you would have to set the private member "_axis3don" to False, like so:

ax = plt.gca(projection='3d') ax._axis3don = False

If you do it this way, then you will get what you want now, and your code will still be compatible with mplot3d when you upgrade (although the preferred method would be to call set_axis_on() or set_axis_off()).

I hope that helps!

Ben Root

Calliper answered 9/9, 2011 at 15:24 Comment(5)
ax.set_axis_off() and set_axis_on() is now supported (1.4.1)Benzoyl
It seems setting axis to off also hides the planes of these axis. Would you know about a solution to hide the axis lines but keep the planes to maintain the perspective?Hickerson
@Hickerson ax.setxticklabels([]) does almost what you want. it does not hide the axis itself but the labels, so the planes are still visible.Taw
AttributeError: 'Axes3DSubplot' object has no attribute 'setxticklabels'Secretive
That should be ax.set_xticklabels([])Tirado
R
9

ax.set_axis_off()

Just to provide a concrete and direct example of what was mentioned at https://mcmap.net/q/398093/-how-can-i-hide-an-axis-of-a-3d-plot

#!/usr/bin/env python3

import numpy as np
import matplotlib.pyplot as plt
from matplotlib.patches import Circle
import mpl_toolkits.mplot3d.art3d as art3d

fig = plt.figure()
ax = fig.add_subplot(111, projection='3d')
ax.set_axis_off()

# Draw a circle on the x=0 'wall'
p = Circle((0, 0), 1, fill=False)
ax.add_patch(p)
art3d.pathpatch_2d_to_3d(p, zdir="x")
p = Circle((0, 0), 1, fill=False)
ax.add_patch(p)
art3d.pathpatch_2d_to_3d(p, zdir="z")

ax.set_xlim(-1.2, 1.2)
ax.set_ylim(-1.2, 1.2)
ax.set_zlim(-1.2, 1.2)

plt.savefig('main.png', format='png', bbox_inches='tight')

Output:

enter image description here

Without ax.set_axis_off() it would look like:

enter image description here

You will notice however that this produces an excessively large whitespace margin around the figure as it simply hides the axes but does not change the viewbox. I tried bbox_inches='tight' and it did not help as it does in 2D. How to solve that at: Remove white spaces in Axes3d (matplotlib)

Tested on matplotlib==3.2.2.
Ramulose answered 15/11, 2020 at 10:56 Comment(0)

© 2022 - 2024 — McMap. All rights reserved.