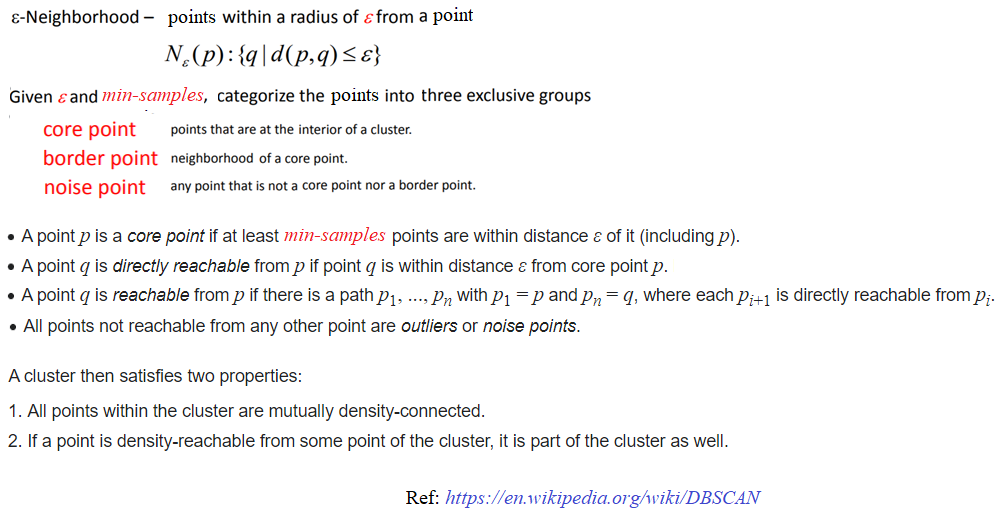
Let's first try to understand a few basic things about DBSCAN density-based clustering, the following figure summarizes the basic concepts.
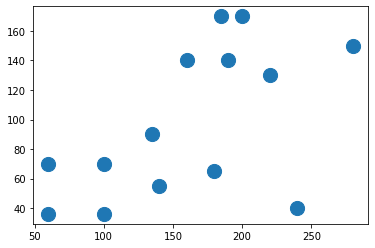
![enter image description here]() Let's first create a sample 2D dataset that will be clustered with DBSCAN. The following figure shows how the dataset looks.
Let's first create a sample 2D dataset that will be clustered with DBSCAN. The following figure shows how the dataset looks.
import numpy as np
import matplotlib.pylab as plt
from sklearn.cluster import DBSCAN

X_train = np.array([[60,36], [100,36], [100,70], [60,70],
    [140,55], [135,90], [180,65], [240,40],
    [160,140], [190,140], [220,130], [280,150],
    [200,170], [185, 170]])
plt.scatter(X_train[:,0], X_train[:,1], s=200)
plt.show()
![enter image description here]()
Now let's use scikit-learn's implementation of DBSCAN to cluster:
eps = 45
min_samples = 4
db = DBSCAN(eps=eps, min_samples=min_samples).fit(X_train)
labels = db.labels_
labels
# [ 0,  0,  0,  0,  0,  0,  0, -1,  1,  1,  1, -1,  1,  1]
db.core_sample_indices_
# [ 1,  2,  4,  9, 12, 13]
Notice from the above results that
- there are 6 core points found by the algorithm
- 2 clusters (with labels 0, 1) and couple of outliers (noise points) are found.
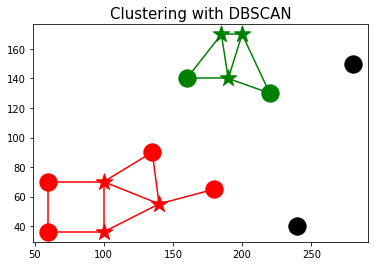
Let's visualize the clusters using the following code snippet:
def dist(a, b):
    return np.sqrt(np.sum((a - b)**2))

colors = ['r', 'g', 'b', 'k']
for i in range(len(X_train)):
    plt.scatter(X_train[i,0], X_train[i,1],
                s=300, color=colors[labels[i]],
                marker=('*' if i in db.core_sample_indices_ else 'o'))

    for j in range(i+1, len(X_train)):
        if dist(X_train[i], X_train[j])  < eps:
            plt.plot([X_train[i,0], X_train[j,0]], [X_train[i,1], X_train[j,1]], '-', color=colors[labels[i]])

plt.title('Clustering with DBSCAN', size=15)
plt.show()
- points in cluster 0 are colored red
- points in cluster 1 are colored green
- outlier points are colored black
- core points are marked with '*'s.
- two points are connected by an edge if they are within ϵ-nbd.
![enter image description here]()
Finally, let's implement the predict() method to predict the cluster of a new data point. The implementation is based on the following:
in order that the new point x belongs to a cluster, it must be directly density reachable from a core point in the cluster.
We shall compute the nearest core point to the cluster, if it's within ϵ distance from x, we shall return the label of the core point, otherwise the point x will be declared a noise point (outlier).
Notice that this differs from the training algorithm, since we no longer allow any more point to become a new core point (i.e., number of core points are fixed).
the next code snippet implements the predict() function based on the above idea
def predict(db, x):
  dists = np.sqrt(np.sum((db.components_ - x)**2, axis=1))
  i = np.argmin(dists)
  return db.labels_[db.core_sample_indices_[i]] if dists[i] < db.eps else -1

X_test = np.array([[100, 100], [160, 160], [60, 130]])
for i in range(len(X_test)):
   print('test point: {}, predicted label: {}'.format(X_test[i],
                                               predict(db, X_test[i])))
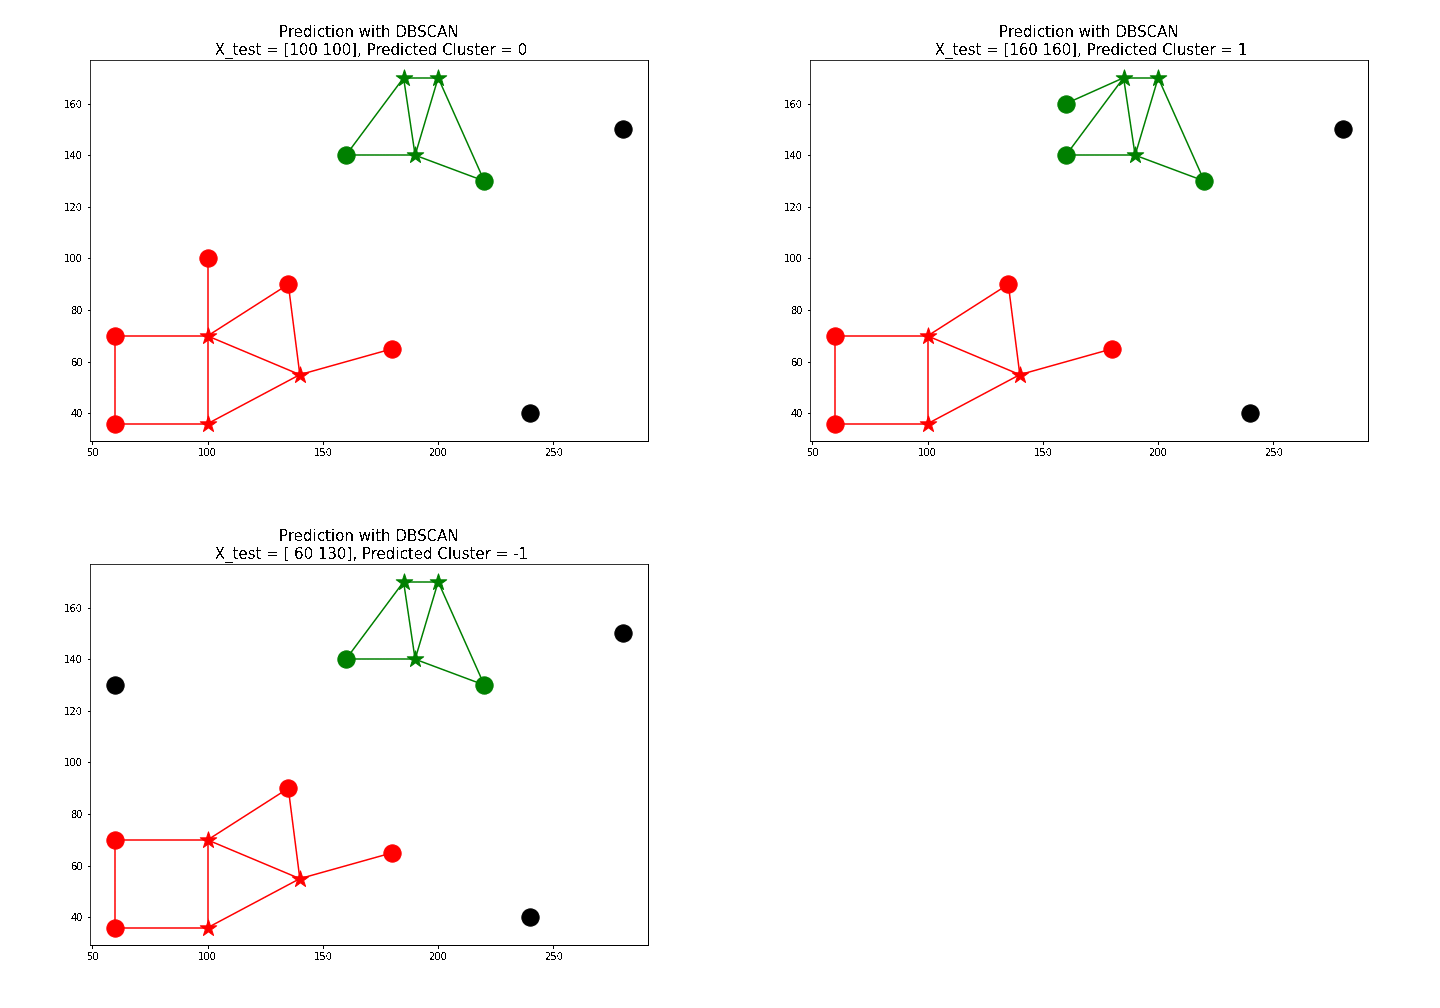
# test point: [100 100], predicted label: 0
# test point: [160 160], predicted label: 1
# test point: [ 60 130], predicted label: -1
The next animation shows how a few new test points are labeled using the predict() function defined above.
![enter image description here]()


predict(X): Predict the closest cluster each sample in X belongs to., and that's typically what one intends to do with "prediction" in the clustering context. – Klingel