Built-in python shell for the current debugging session
- Set a breakpoint at the line of interest in your code (i.e. by clicking the gutter), and launch debug (right-click in the editor then pick Debug myfile.py...).
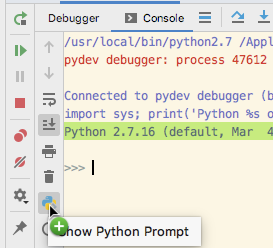
- When the breakpoint is reached, locate the Debug > Console tab, and then click the Show command line icon (see screenshot).
This will enable a python shell (notice the green >>> on the screenshot) where you can access all the variables in the current scope, and do everything you usually do in the Python shell.
In recent pycharm versions you get the full ipython interpreter instead of the plain python shell (if ipython is installed).
![Enabling Python shell for the debugged app]()
The Evaluate expression window
As a more comfortable alternative, if you only need to inspect some variables, access members or call methods on an object in scope, once a breakpoint is reached, select an expression in the current scope, right-click -> Evaluate Expression (or use the hotkey shown in the menu under Run → Evaluate Expression...), edit as needed — you can type any python expression, with auto-completion available — and then press Enter (or click Evaluate) to inspect the result.
Multiple and multiline expressions are supported: to get a multiline version of the Inspect dialog click the Code fragment mode or select more than one line of code in the editor and then evaluate the expression. You can assign values to existing variables (new ones cannot be defined), and run entire chunks of code.
![inspecting variables in the current scope]()
Mouse hover over variables
To see the value of a variable after you hit a breakpoint in debug mode, hover the mouse pointer over the variable (1-2 seconds) and the value will be shown in a tooltip.
![enter image description here]()
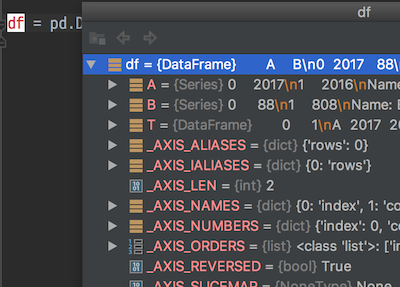
The hint will contain a ➕ icon — clicking it will open the inspector in a popup.
![enter image description here]()
For the variables in scope the inspector is shown in the bottom panel under Debug > Debugger.
For pandas data frames you will see a View as DataFrame link in the variable inspector panel or in the hover popup — clicking the link will display the dataframe as a table in the Data View panel.
Update
In the more recent Pycharm versions (2019+) the interpreter icon now looks different:
![pycharm interpreter icon]()
Also in the unittest/pytest debugging UI the icon is placed first in the icon bar.


