I tend to write rather large templated header-only C++ libraries and my users commonly complain about compilation times. After thinking about the matter, it occurred to me that I have no idea where the time is going. Is there some simple way to profile the C++ compilation process with common compilers, such as GCC (g++), Intel C++ Compiler (icc), and XL C/C++ (xlC)? For instance, is it possible to get an idea of how much time is spent within each of the phases of C++ compilation?
For GCC there are debugging options to find how much time is spent within each of the phases of C++ compilation?
-Q Makes the compiler print out each function name as it is compiled, and print some statistics about each pass when it finishes.
-ftime-report Makes the compiler print some statistics about the time consumed by each pass when it finishes.
Passes are described in GCCINT 9: Passes and Files of the Compiler.
You can post output of g++ compilation of single source file with -v -ftime-report here to discuss it. There could be some help on the GCC mailing list.
For compilers other than GCC (or GCC more ancient than 3.3.6), see the other options in other answers.
-Q output may be grabbed, parsed and analyzed by some awk or perl script; or you can just watch on function name printing on the console, the any which was printed after long pause was hard to compile. –
Phonemics gcc/toplev.c ( announce_function - "when the start of a function definition is parsed, this function prints on stderr the name of the function"). This announce_function may be the point to add printing of timestamp (gettimeofday), or rewriting output to some unbuffered way. Or the other possible way is to enable debug dumps (-fdump-rtl-all-all -fdump-tree-all-all -fdump-ipa-all-all) but they will output 1 file per pass; you need convert them to output 1 file per pass and per function (get lot of files with creation time). –
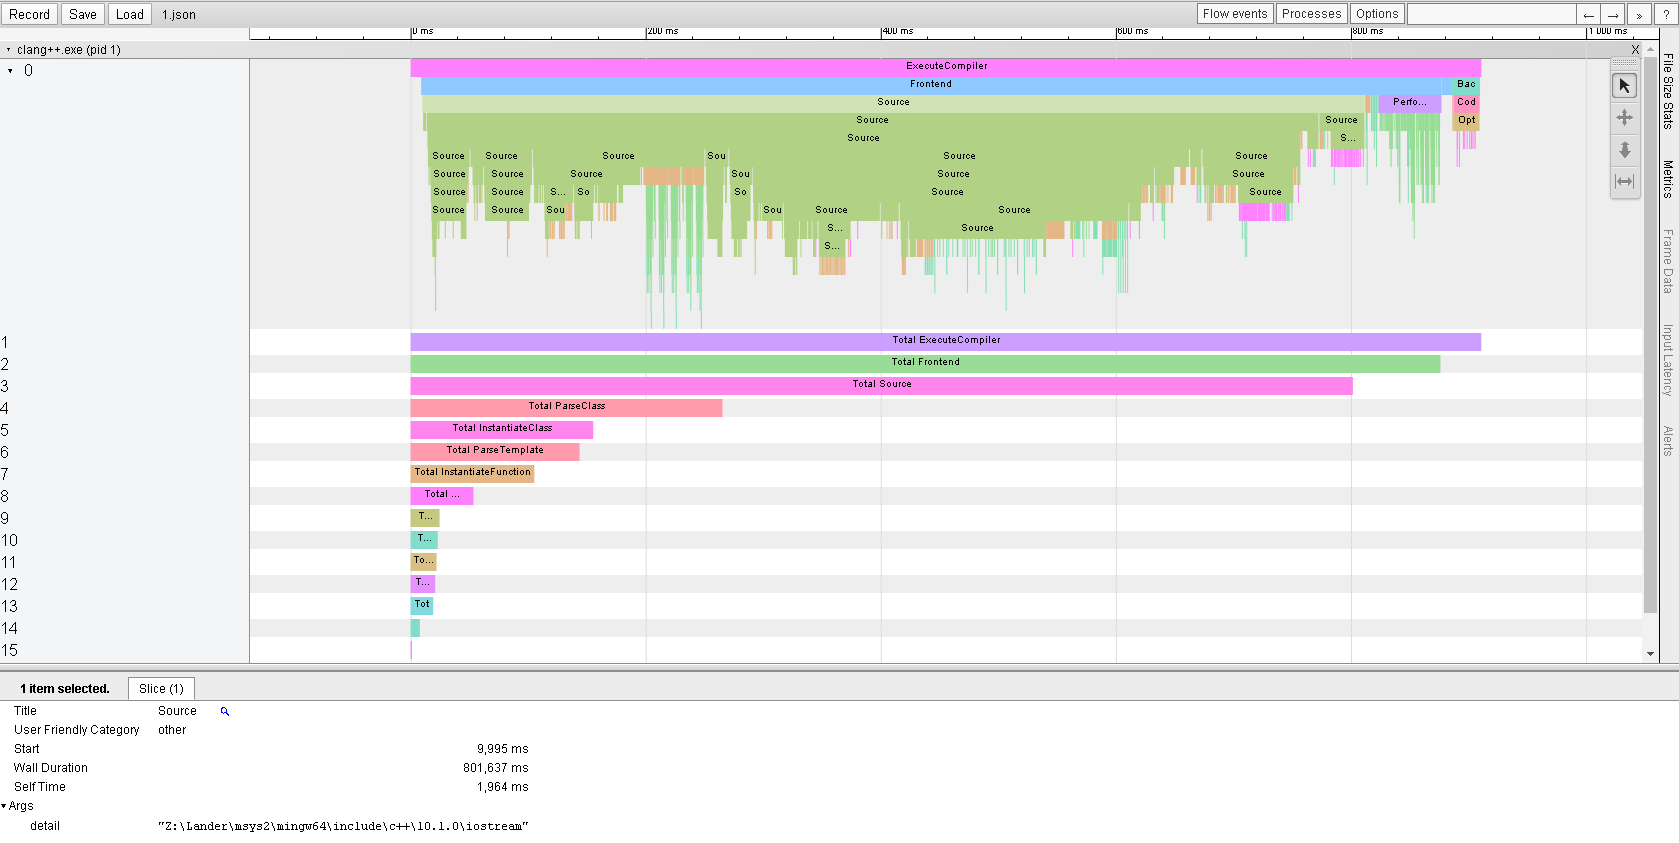
Phonemics Clang 9 (and newer) has a -ftime-trace flag, which makes it output a profiling report as JSON (in addition to an object file).
You can import this file into a profiler that comes with Chrome (chrome://tracing) to get a nice visualisation:
The bars correspond to headers that had to be parsed, and for each header, specific classes (and probably other constructs) that had to be parsed. It also reports time spent on instantiating specific templates.
There's a tool from the Boost project, which could be useful for pretty much any compiler and build system.
The tool requires source code instrumentation with TEMPLATE_PROFILE_ENTER() and TEMPLATE_PROFILE_EXIT() macro calls. These macros then generate specific diagnostics (warnings) at compile-time, which are timed and collected along with instantiation callstacks (which consequently allow building and visualizing callgraphs) by a script. Not bad, IMO.
I didn't use it yet though.
You can separate them out to some extent (I'm assuming Make)
- add a build rule that only preprocesses files (using the -E switch), and a
.PHONYtarget that depends on the preprocessor output files just like the normal binary target depends on.ofiles. Measure how long it takes to build this target - add a
'PHONYtarget that depends on all the.ofiles, but doesn't link them. Measure how long it takes to build this target (from clean) - measure how long it takes to do a clean build of the usual binary
Now you have some idea how long it takes to pre-process, compile, and link. You can also compare optimized and non-optimized (-O0) versions of the second and third target, to see how long is spent in the optimizer.
You might be able to get some traction with some variant on strace -e trace=process -f -r -ttt -T, at least for compilers like g++ that are broken up into many processes.
Externis is a GCC plugin that will generate trace files very similar to Clang's -ftime-trace:
Disclaimer: I'm the author of this plugin.
Others have already suggested the -ftime-report command line flag for GCC, which makes the compiler print some statistics about the time consumed by each compilation phase. The drawback is that it only shows summary for one unit.
I've written a Python script, which allows to print the total summary on all units, by each compilation phase, given the project build log file. It also allows sorting by different phases. And it also allows to compare two log files (e.g., if you're trying to understand the impact of your changes).
© 2022 - 2024 — McMap. All rights reserved.


