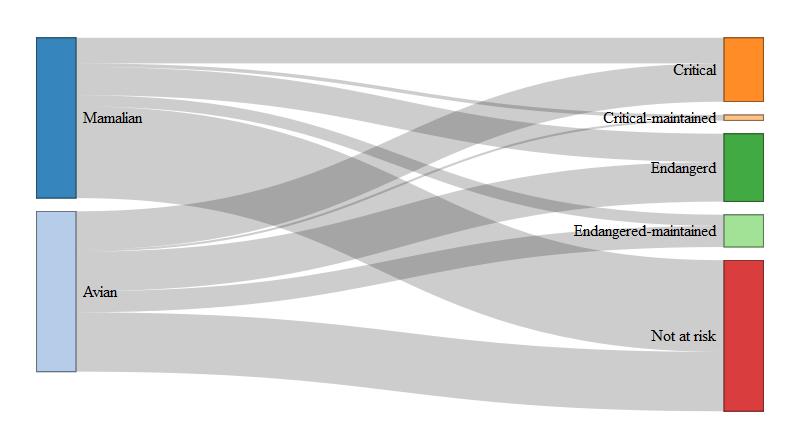
I am trying to build sankey plot using networkD3 library. I have following code and data:
# Plotting the Sankey network diagram
nodes = data.frame("name" =
                     c("Mamalian", # Node 0
                       "Avian", # Node 1
                       "Critical", # Node 2
                       "Critical-maintained", # Node 3
                       "Endangerd", #Node 4
                       "Endangered-maintained", #Node 5
                       "Not at risk")) # Node 6

links = as.data.frame(matrix(c(
  0, 2, 16, # Note the values in the final column refer to the % of breeds in each risk category
  0, 3, 2.2,
  0, 4, 17.6,
  0, 5, 7.0,
  0, 6, 57.2,
  1, 2, 23.9,
  1, 3, 1.3,
  1, 4, 24.7,
  1, 5, 13.1,
  1, 6, 37.0),
  byrow = TRUE, ncol = 3))
names(links) = c("source", "target", "value")
sankeyNetwork(Links = links, Nodes = nodes,
              Source = "source", Target = "target",
              Value = "value", NodeID = "name",
              fontSize= 12, nodeWidth = 30, iterations = 0)
I want to manually change the colours associated with each node, as they ddo not currently correspond with the endangerment categories I have listed. How can I do this?


colourScale. – Disconformity